
Fig. 6.
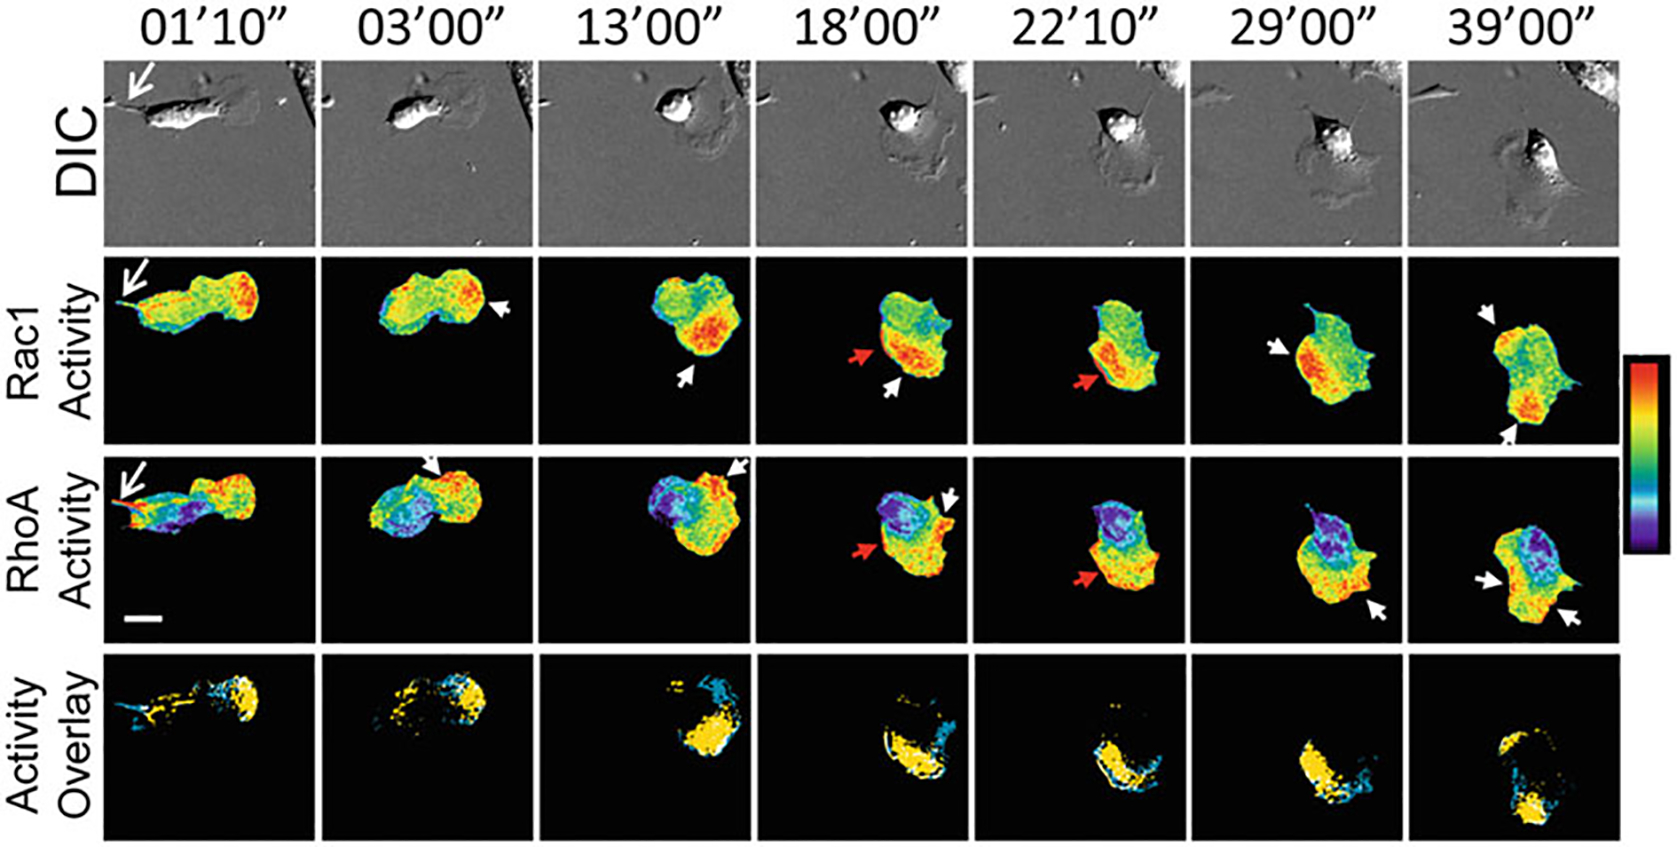
Representative, timelapse panels of RhoA and Rac1 activities imaged in a single living MEF, reproduced from Shcherbakova et al. 2018 Nature Chemical Biology [1]. Top panels: Differential interference contrast. Middle two panels: Rac1 activity (NIR FRET Rac1 biosensor; Upper panels) and RhoA activity (CFP-YFP FRET RhoA biosensor; Lower panels). Bottom panels: Localizations of high Rac1 (yellow) and high RhoA (blue) activities are overlaid, where regions of colocalization are shown in white. Regions of high Rac1 and RhoA activities were defined by intensity thresholding the top 2.5% of pixel ratio values within the image intensity histogram. Regions and features of interest are shown using matching colored arrowheads. White bar = 20 μm. Pseudocolor bar corresponds to ratio limits of 1.0 to 1.55 for Rac1 and 1.0 to 1.32 for RhoA activities (black to red)