
Figure 2.
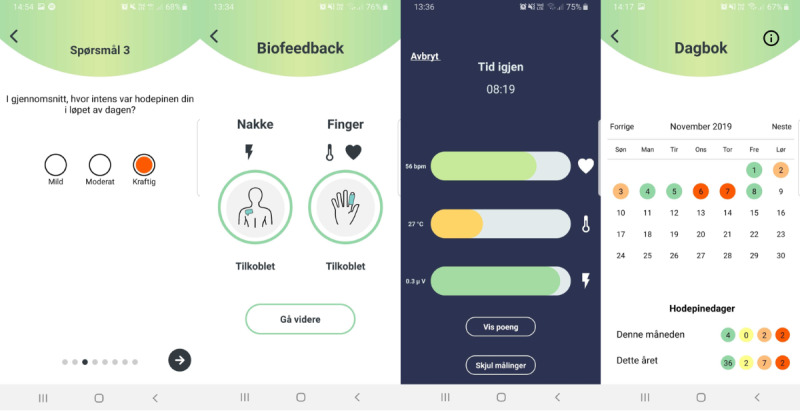
App screenshots. Left: Sample question in the headache diary where users are asked to rate headache intensity (On average, how intense was your headache during the day?). Center left: Instructions on how to connect the sensors. Center right: Visualization during the biofeedback session. Each of the three parameters is displayed as a horizontal column increasing in width with increasing score and correspondingly changing color. Right: Headache diary overview allowing for easy visualization of previous headache diary entries.