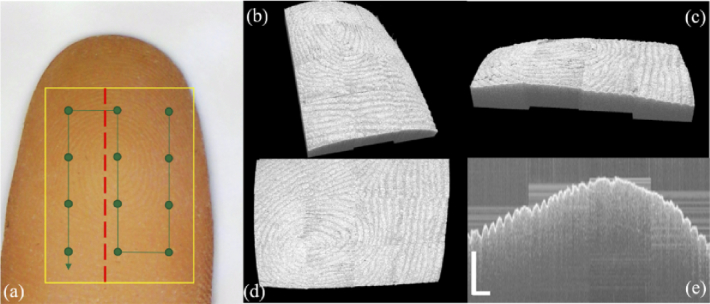
Fig. 10.
(a) Photo of the fingertip phantom. scanning range is outlined with yellow box, scan path is shown in green line with scan points marked; 3D reconstruction of the fingertip phantom in (b) isotropic view, (c) front view, (d) top view and (e) stitched cross sectional image along the red dashed line. (scale bar: 1 mm)

