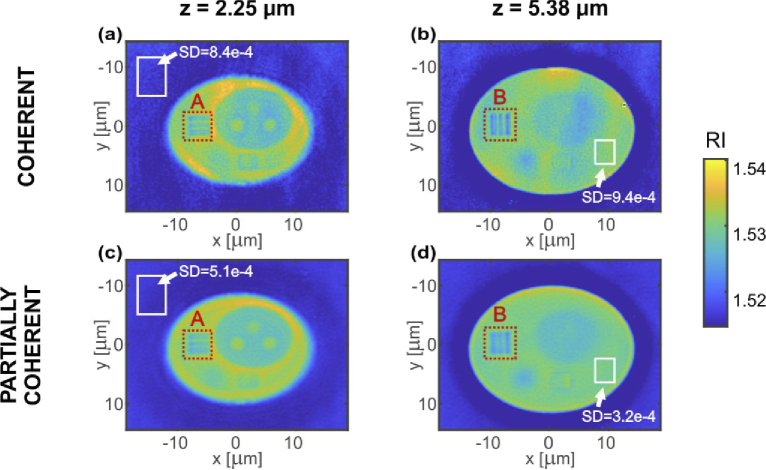
Fig. 6.
DI tomographic reconstructions. Two transverse (XY) cross-sections of the reconstructed 3D refractive index distributions were selected for axial depths of: (a,c) z = 2.25 µm and (b,d) z = 5.38 µm. Cross-sections (a,b) were obtained for coherent LD illumination and (c,d) for partially coherent SLD illumination. White rectangles show the regions used for the estimation of SD, red dotted rectangles specify the ROIs (A and B) that are further analyzed in Fig. 8.

