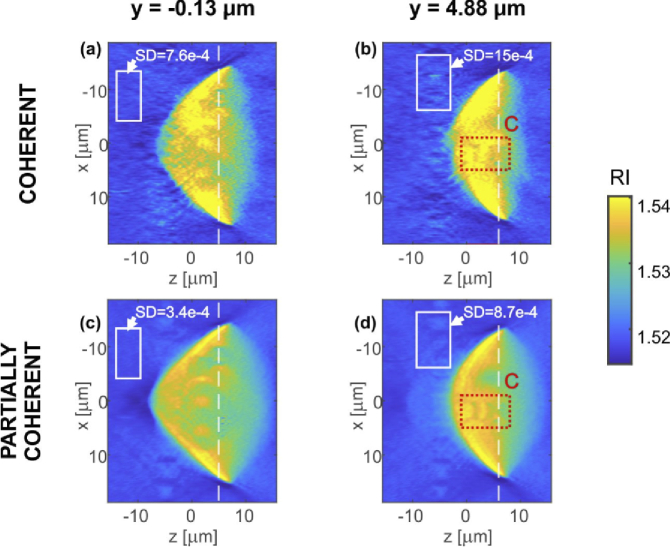
Fig. 10.
DI + NNC tomographic reconstruction. Two axial (ZX) cross-sections of the reconstructed 3D refractive index distributions were selected for y positions of: (a,c) y = −0.13 µm and (b,d) y = 4.88 µm. Cross-sections (a,b) were obtained for coherent LD illumination and (c,d) for partially coherent SLD illumination. White rectangles show the regions used for the estimation of SD; red dotted rectangles specify ROI C further analyzed in Fig. 11.

