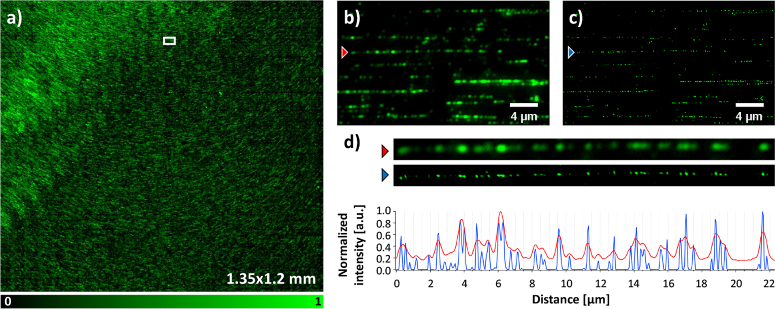
Fig. 5.
Fluorocode imaging of labeled bacteriophage lambda DNA, stretched on a coated coverslip, with HIT-SIM. (a) Stitched wide-field image (displayed 1.35×1.2 mm), with an inset magnified in (b) and (c). (b)Wide-field and (c) reconstructed SIM with respectively red and blue arrows indicating a labeled DNA sequence. A zoom of the DNA sequence from (b) and (c) accompanied by a line plot (respectively red and blue) are given in (d). This imaging sequence was obtained using the 1.75× resolution enhancement OSA and 561 nm laser.

