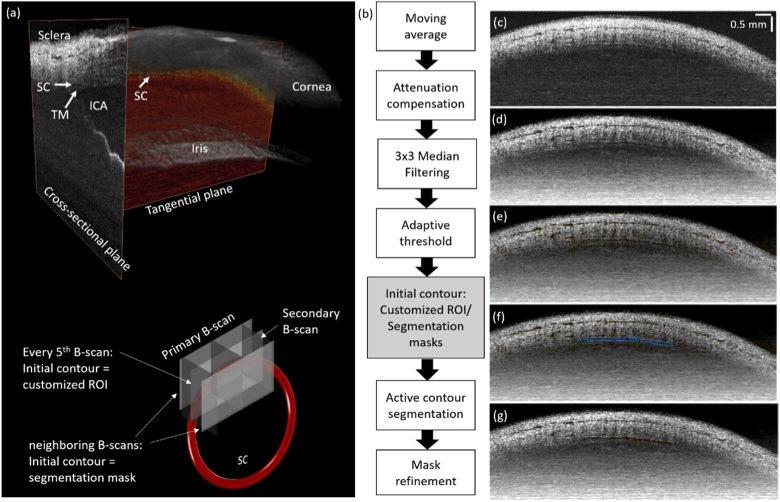
Fig. 2.
(a) Three-dimensional illustration of an OCT volumes taken at the cardinal position, with anatomical landmarks annotated. (See Visualization 1 (8MB, mp4) ) TM: trabecular meshwork; ICA: irido-corneal angle. Bottom: an illustration of the B-scans in an OCT volume with respect to the SC, and the initial contour definition for different primary B-scans. (b) Flowchart of the SC segmentation process. (c) – (g) Images generated from the steps of the flow chart. At every five B-scans in each volume, customized ROI was used for initial contour generation. The segmentation results of these B-scans were then employed for the neighboring B-scans for initial contour generation.

