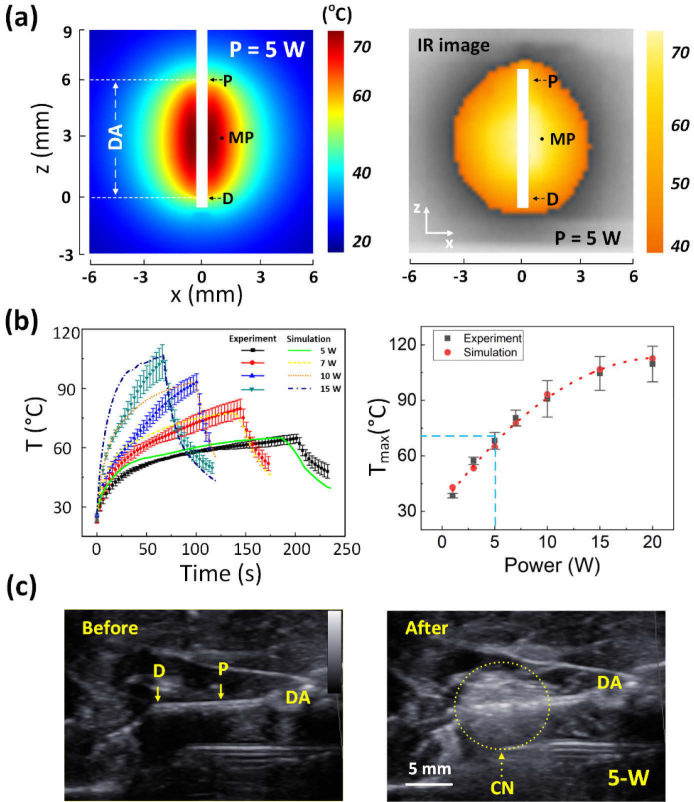
Fig. 4.
Quantitative evaluations on thermal responses of ex vivo pancreatic tissue to CILA at various power levels: (a) numerical simulation (left) and experiment (right; IR image) on spatial distribution of tissue temperature after irradiation of 5 W for 200 s (1000 J delivered; DA = diffusing applicator; MP = measured point at r = 1 mm away from DA; P and D = proximal and distal ends of DA), (b) temporal developments of temperature measured at MP during 200-s irradiation at various power levels (left; 5, 7, 10, and 15 W) and maximum interstitial temperature (Tmax) measured at MP as function of power (right; N = 5), and (c) cross-sectional US images of pancreatic tissue captured before (right) and after (left) 5-W CILA for 200 s (CN = coagulation necrosis).

