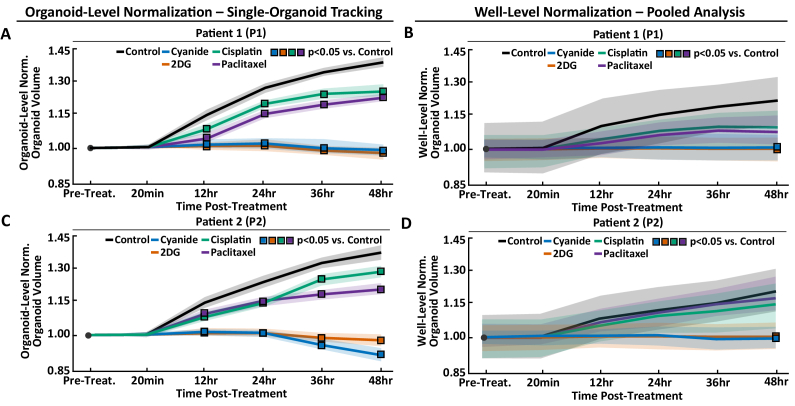
Fig. 4.
Comparison of Single-Organoid Tracking and Pooled Analysis. Comparison of single-organoid tracking and pooled analysis using time series data from Patient 1 (P1) and Patient 2 (P2) PCOs. Normalization refers to dividing the value of each organoid at each time-point by either its own pre-treatment value (organoid-level normalization) or the well-level mean (well-level normalization). (A,B) Pre-treatment normalized organoid volume for P1 using organoid-level normalization (A) and well-level normalization (B) for each treatment group. (C,D) Pre-treatment normalized organoid volume for P2 using organoid-level normalization (C) and well-level normalization (D) for each treatment group. Data in A,C were analyzed using a linear mixed-effect model that uses single-organoid tracking to account for organoid-level variability. Data in B,D were analyzed using a linear mixed-effect model that does not account for organoid-level variability due to the lack of single-organoid tracking. Data plotted is mean (lines) ± standard error of the mean (shaded area). Significant differences between a treatment and control (p < 0.05) are indicated with a square color-coded for the treatment group (see legend). Table 1 shows the number of PCOs in each group and for each patient.

