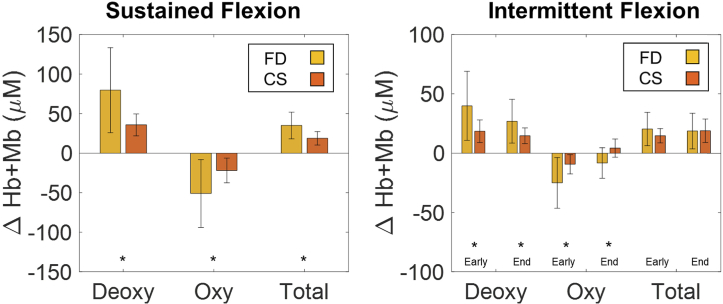
Fig. 8.
Summarized results from the healthy volunteer study comparing FD-NIRS analysis to constant scattering (CS) analysis. The bars indicate the mean and the error bars indicate the standard deviation of the group of volunteers. The asterisk indicates that the FD and CS values are significantly different using a Mann-Whitney U Test (p < 0.05).

