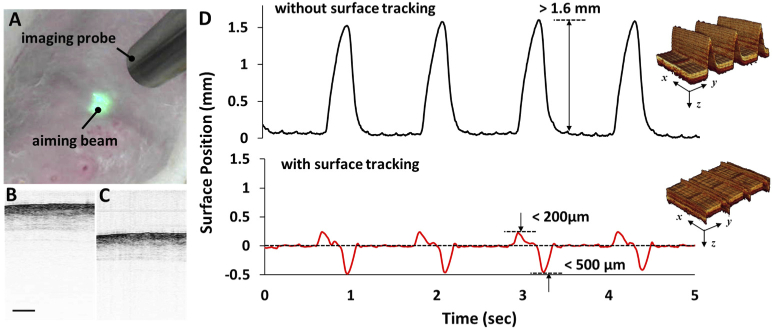
Fig. 5.
(A) Visualization 1 (13.9MB, gif) ; The surface-tracking probe simultaneously followed the rat chest motion due to breathing when the surface tracking was enabled. Green aiming laser indicates the imaging area. (B-C) Visualization 2 (1.5MB, gif) and Visualization 3 (3.2MB, gif) ; Recorded real-time OCT images of the rat chest during breathing without (B) and with (C) surface tracking. (D) Recorded surface position changes with and without surface tracking. The inset images show reconstructed 3D images with 512 consecutive B-frame images. Scale bar: 1 mm.

