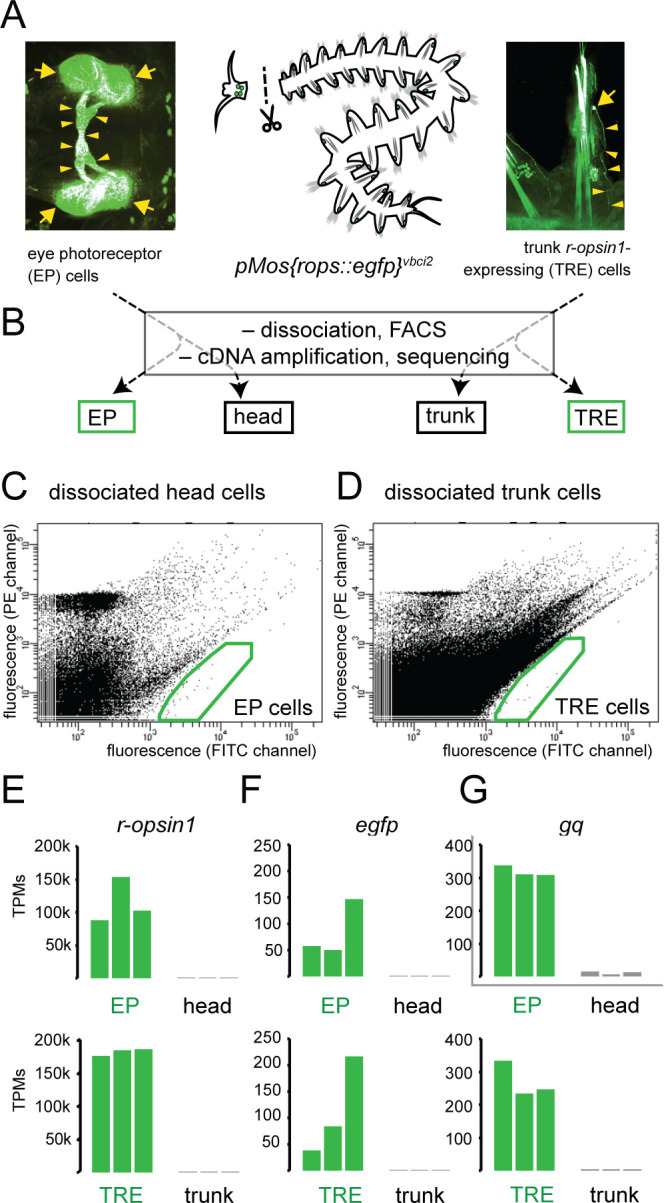
Figure 1. Establishment of molecular signatures of eye photoreceptors (EPs) and trunk r-opsin1-expressing (TRE) cells.
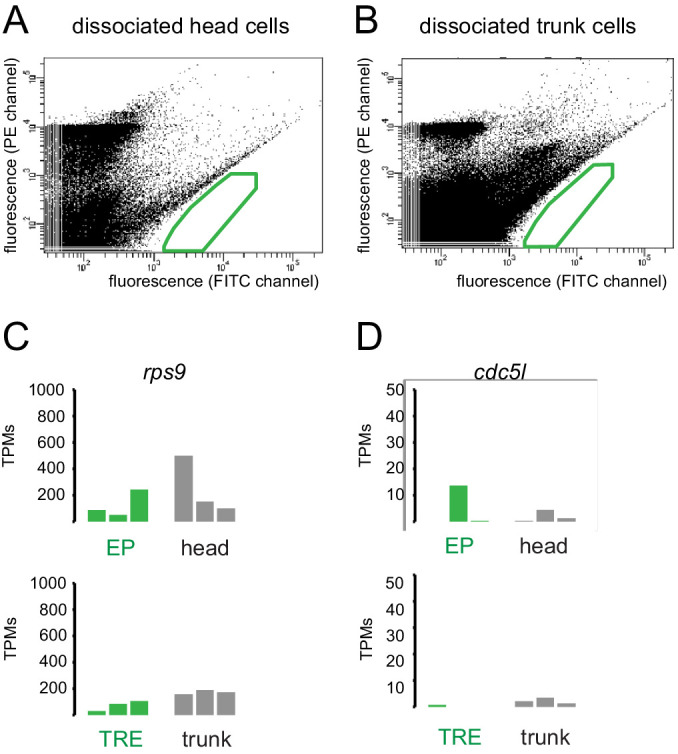
(A) Dissection of pMos{rops::egfp}vbci2 individuals, separating the head containing EP cells (left panel) from trunk containing TRE cells (right panel). (B) Overview of cDNA library generations, resulting in fluorescence-activated cell sorting (FACS)-enriched (EP, TRE) and unsorted (head, trunk) samples. (C, D) Representative FACS plots showing gated populations (green boxes) of EP and TRE cells, respectively. For non-transgenic controls, see Figure 1—figure supplement 1A, B. (E–G) Comparison of transcripts per million reads (TPM) for the genes r-opsin1 (E), enhanced green fluorescent protein/egfp (F), and gαq/gq (G) in individual replicates of EP, head, TRE, and trunk libraries. For comparison of TPMs for non-enriched control genes, see Figure 1—figure supplement 1C, D. Arrows and arrowheads in (A) designate EGFP-positive cell bodies and projections, respectively.

Figure 1—figure supplement 1. Fluorescence-activated cell sorting (FACS) profiles of dissociated cells from wild-type heads and trunks.

