Figure 6. r-opsin1 mediates blue light modulation of trunk r-opsin1-expressing (TRE) signature and undulation behavior.
(A) atp2b/c7424 expression levels (in transcripts per million reads [TPMs]) in individual replicates of r-opsin1+/+ and r-opsin1-/- worms cultured for 3–5 days in bright blue light. For Atp2b2 phylogeny, see Figure 6—figure supplement 1. (B) Scheme of decapitated worm trunks as used in experiments (D–H) that survive for up to 14 days. (C) Spectral profile of bright blue and dim white light. The blue dot indicates the irradiance at 471 nm (λmax of P. dumerilii r-Opsin1). (D) atp2b/c7424 expression levels (in TPMs) in individual replicates of decapitated worms cultured for 3–5 days in bright blue light or dim white light. (E–H) Undulation behavior of decapitated worms. (E) Light regime. Black portions of the horizontal bar indicate ‘night’ (light off), yellow portions indicate ‘day’ (light on), and gray portions indicate ‘subjective day’ (light off during ‘day’ period). ZT: zeitgeber time; CT: circadian time. (F, G) Undulation ratio during ‘day’ (F) and ‘subjective day’ (G). Each black (red) point represents the mean of all wild-type (mutant) worms within a 3 min window, and vertical bars represent the standard error of the mean (n = 32 for each genotype, distributed among three independent experiments). For reliability tests of the algorithm used to detect undulation behavior, see Figure 6—figure supplement 3. (H) Area under the curve obtained from the undulation ratios shown in (F) (yellow background; ‘Day’) and (G) (gray background; ‘Subjective day’). Circles indicate data corresponding to individual worms. Boxplots indicate the median (thick horizontal line), the 50% quantile (box), and 100% quantile (error bars). Filled circle indicates an outlier (as determined by the boxplot function of the ggplot R package). *p-value<0.05; **p-value<0.01 (Wilcoxon rank-sum and signed-rank tests). For behavioral responses to strong light of r-opsin+/+ and r-opsin-/- trunks, see Figure 6—figure supplement 2.

Figure 6—figure supplement 1. Atp2b2 phylogeny and enrichment of atp2b2 in zebrafish neuromasts.
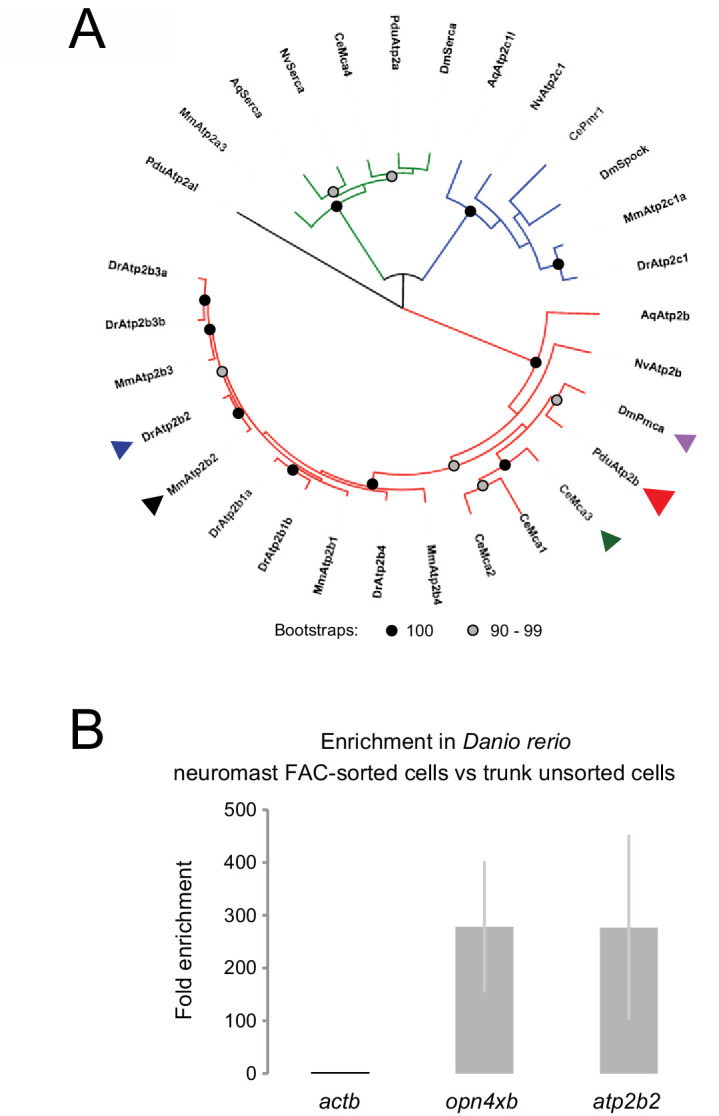
Figure 6—figure supplement 2. Net avoidance crawling distance of decapitated r-opsin+/+ and r-opsin-/- worms in response to strong light.
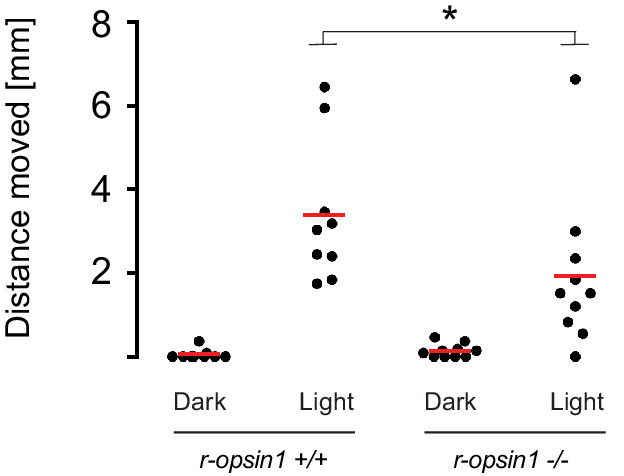
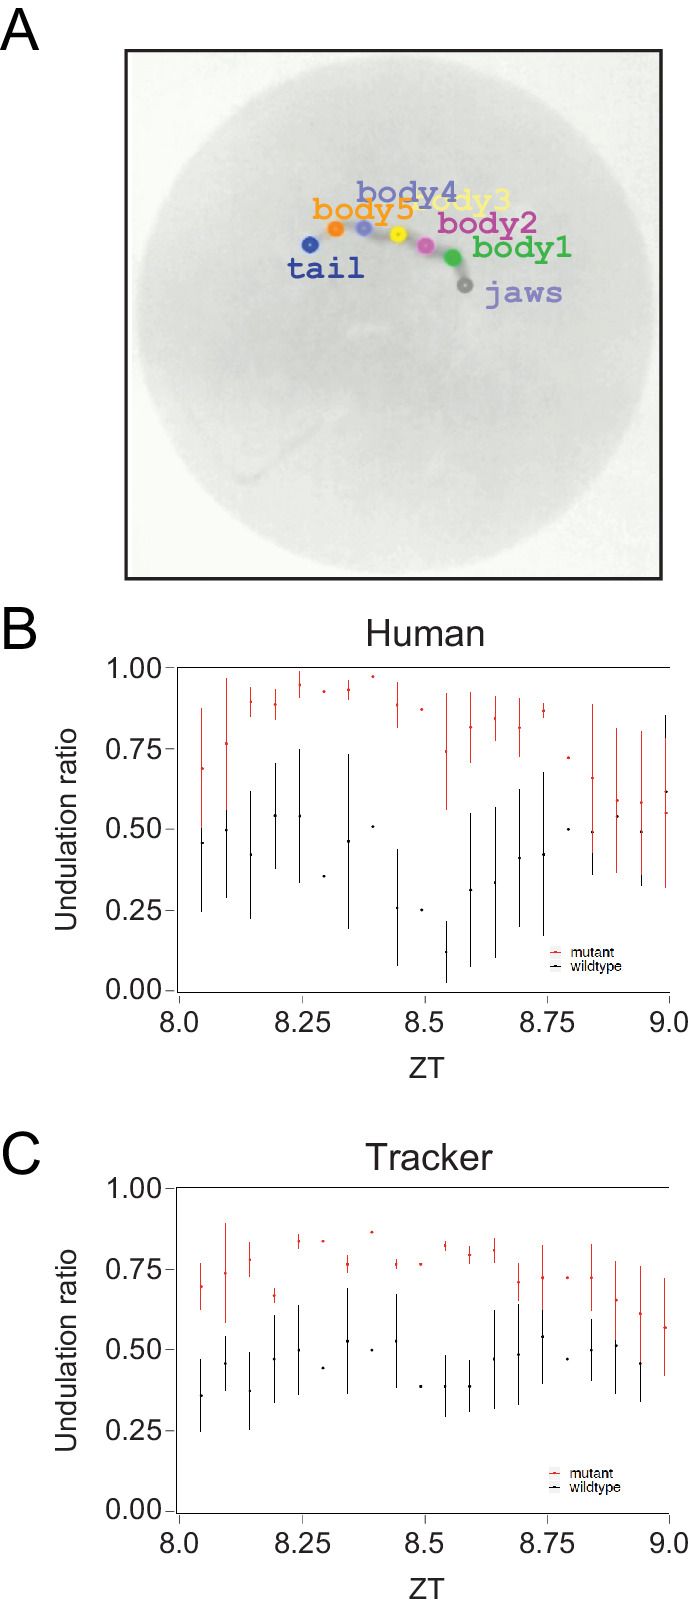
Figure 6—figure supplement 3. Benchmarking the algorithm used to detect undulation behavior.