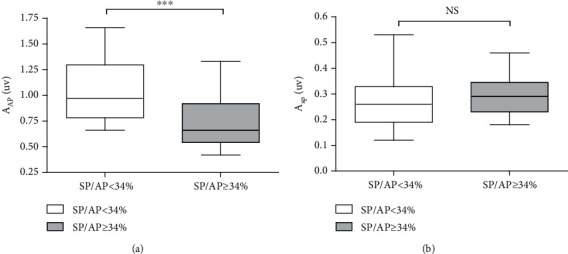
Figure 4.

The amplitude of the AP and SP between the two groups. (a) A significant decrease in the AP amplitude of the patients with high SP/AP ratios. (b) There was no difference in the SP amplitude between the two groups. ∗∗∗p < 0.001. NS p > 0.05. Abbreviations: PTA: pure-tone audiometry; SP: summating potential; AP: action potential; NS: nonsignificant; AAP: amplitude of AP; ASP: amplitude of sp.
