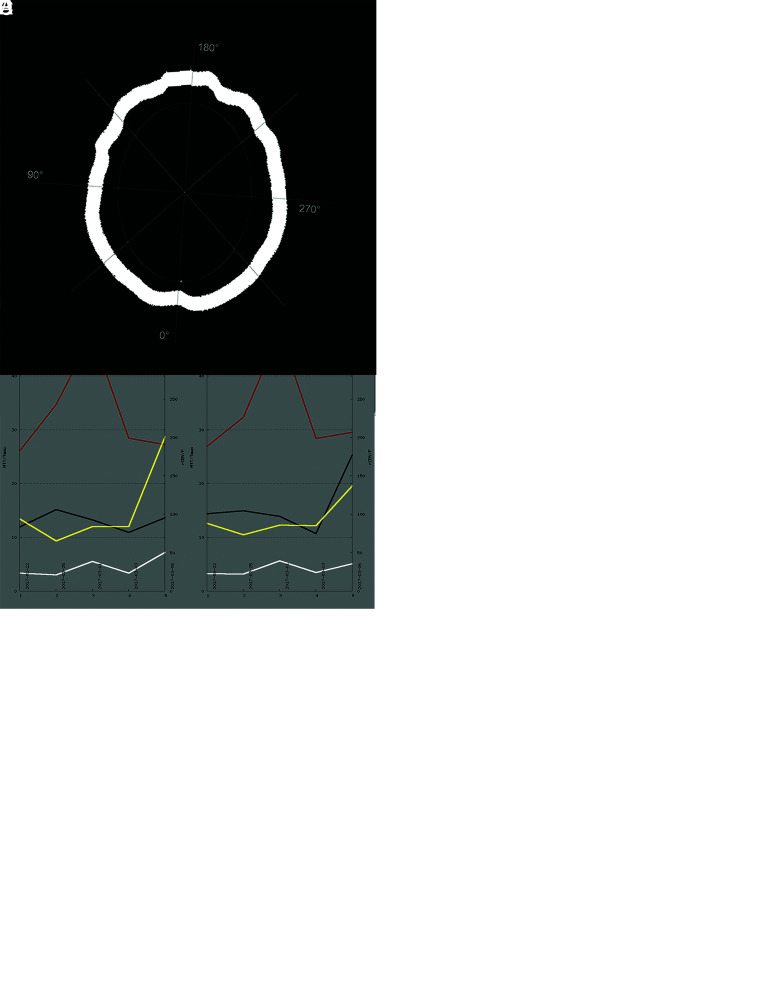
FIG 1.
Exemplary illustration of CTP imaging in patients with SAH. A, A series of axial CTP scans at the level of the cella media of the lateral ventricles, parallel to the orbitomeatal plane, thereby representing 6 supratentorial vessel territories. B, Calculated perfusion parameter maps in clockwise order from top left: MTT, Tmax, and semi-quantitative relative CBF (rCBF) as well as CBV (rCBV). C, Depiction of the ROI automatically defined along the cortex. Readout starts in the territory of the right posterior cerebral artery and is carried out in a clockwise manner using a sliding-window approach (mean across 10° in 2° steps). D, Display of 180 measurements across 360° (red, MTT; black, Tmax; yellow, rCBF; white, rCBV). E, Mean perfusion parameters over 5 CTP scans for the left hemisphere on the left and the right hemisphere on the right side. Note the marked pathologic elevation of MTT (red) in the third scan.

