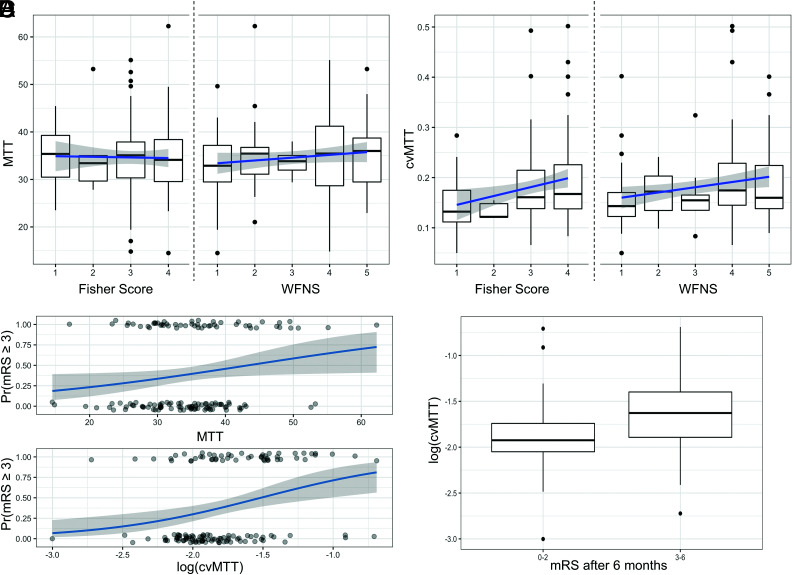
FIG 2.
Correlation of MTT and the cvMTT with the dichotomized outcome after 6 months. A, Mean MTT distribution of the Fisher grade (left) and the WFNS grades (right). The MTT did not correlate with the initial WFNS grade (P = .18) or Fisher grade (P = .86) at admission. B, cvMTT distribution for the Fisher grade (left) and the WFNS grades (right). The cvMTT correlates significantly with the WFNS (P = .014) and the Fisher grade (P = .011) at admission. C, Upper graph: MTT as a predictor of the dichotomized mRS after 6 months (logistic regression: OR =1.05, 95% CI, 1.004–1.103; P = .034); lower graph: cvMTT as a predictor of the dichotomized mRS after 6 months (logistic regression: OR = 5.09; 95% CI, 1.46–17.77; P = .011). D, cvMTT for favorable and unfavorable outcomes (mRS after 6 months ≤2 and ≥3, respectively). Pr(mRS ≥ 3) indicates probability (mRS >= 3).

