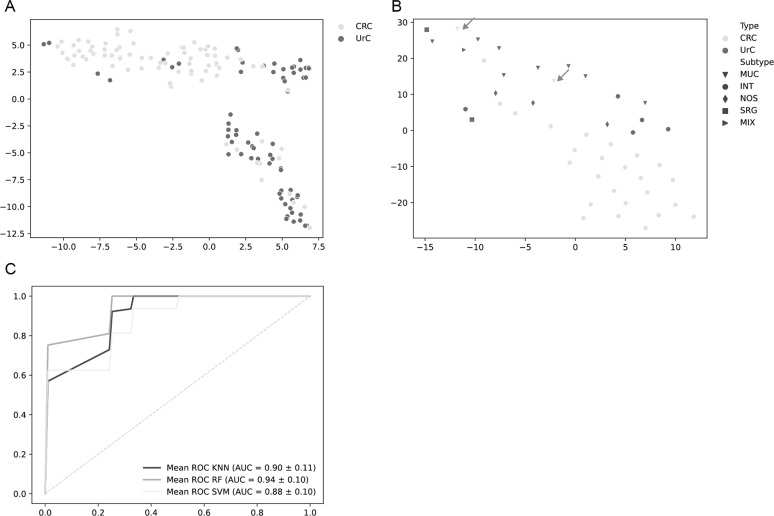
Fig. 2. Visualization of metabolic differences between urachal adenocarcinomas (UrC) and colorectal adenocarcinomas (CRC).
A t-distributed stochastic neighbor embedding (t-SNE) algorithm. Each dot represents one TMA core. UrC cores: n = 66, CRC cores: n = 80. B Visualization of cases via t-SNE including tumor subtypes. Arrows indicate mucinous CRC. UrC: n = 19, CRC: n = 27. C Receiver operating characteristic (ROC) analysis of a cross-validated k-nearest neighbors algorithm (black), random forest algorithm (dark gray), and support-vector machine algorithm (light gray) on tumor cases. UrC: n = 19, CRC: n = 27. MUC: mucinous subtype, INT: intestinal subtype, NOS: not otherwise specified subtype, SRG: signet-ring cell subtype, MIX: mixed subtype, KNN: k-nearest neighbors, RF: random forest, SVM: support-vector machine.

