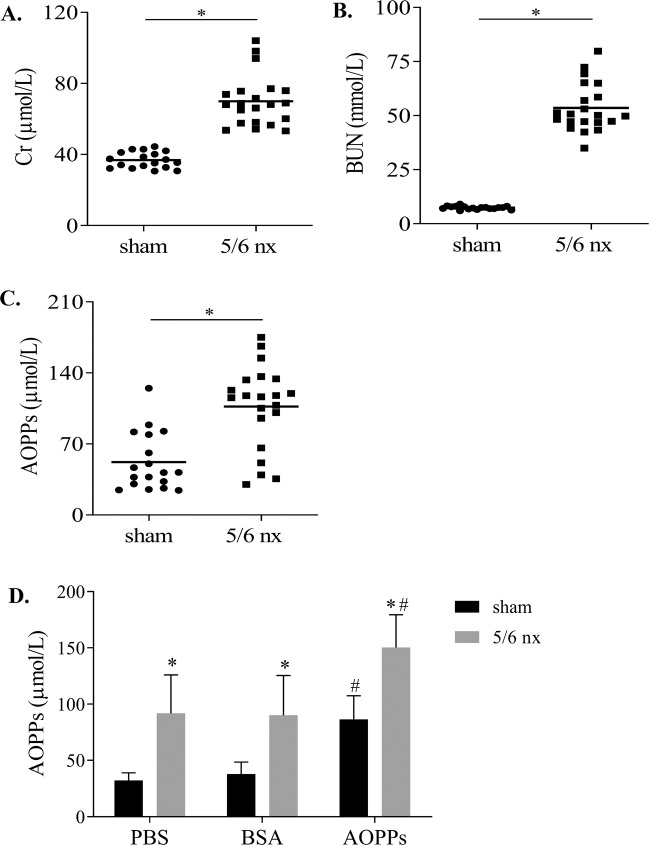
Fig. 1. AOPPs administration increased AOPPs accumulation in the plasma.
Kidney function of 5/6 nx rats was assessed based on Cr (A) and BUN (B), which indicated reduced renal function. Plasma AOPPs concentration was increased in 5/6 nx rats (C). After AOPPs administration, the plasma AOPPs concentration in the sham and 5/6 nx rats increased (D). The results are shown as a scatter plot and each point represents one rat. *p < 0.05 compared with the sham group; #p < 0.05 compared with the PBS group.

