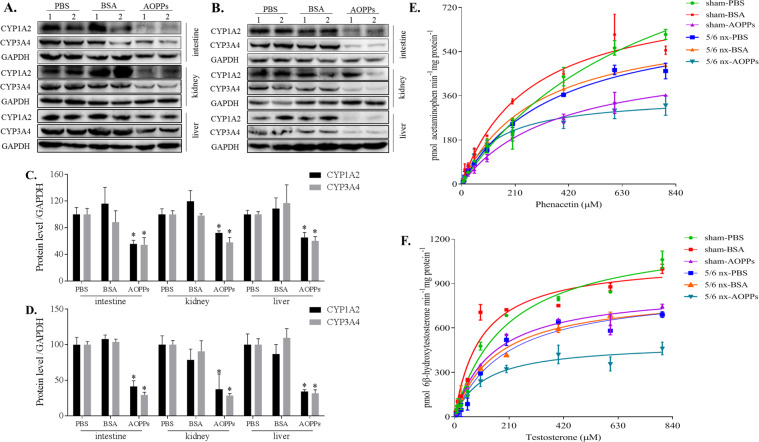
Fig. 2. AOPPs downregulated the protein expression and activities of CYP1A2 and CYP3A4 in vivo.
Total protein was extracted from the intestine, kidney, and liver in the sham (A) and 5/6 nx groups (B), and the protein expression of CYP1A2 and CYP3A4 in a whole-cell lysate was evaluated by western blotting. Proteins expression levels were quantified by ImageJ software (C, D). Each experiment was performed with a different isolate. Michaelis–Menten plots of acetaminophen (E) and 6β-hydroxytestosterone (F) were constructed after incubation of liver microsomes (extracted from the liver tissues in the sham and 5/6 nx groups) with NADPH and various concentrations of phenacetin or testosterone, respectively, which were used to evaluate the activities of CYP1A2 and CYP3A4, respectively. Each data point represents the mean of three replicates and the error bars represent standard error of the mean (n = 3). Data are presented as mean ± SD; *p < 0.05 compared with the PBS group. Data were normalized to GAPDH.

