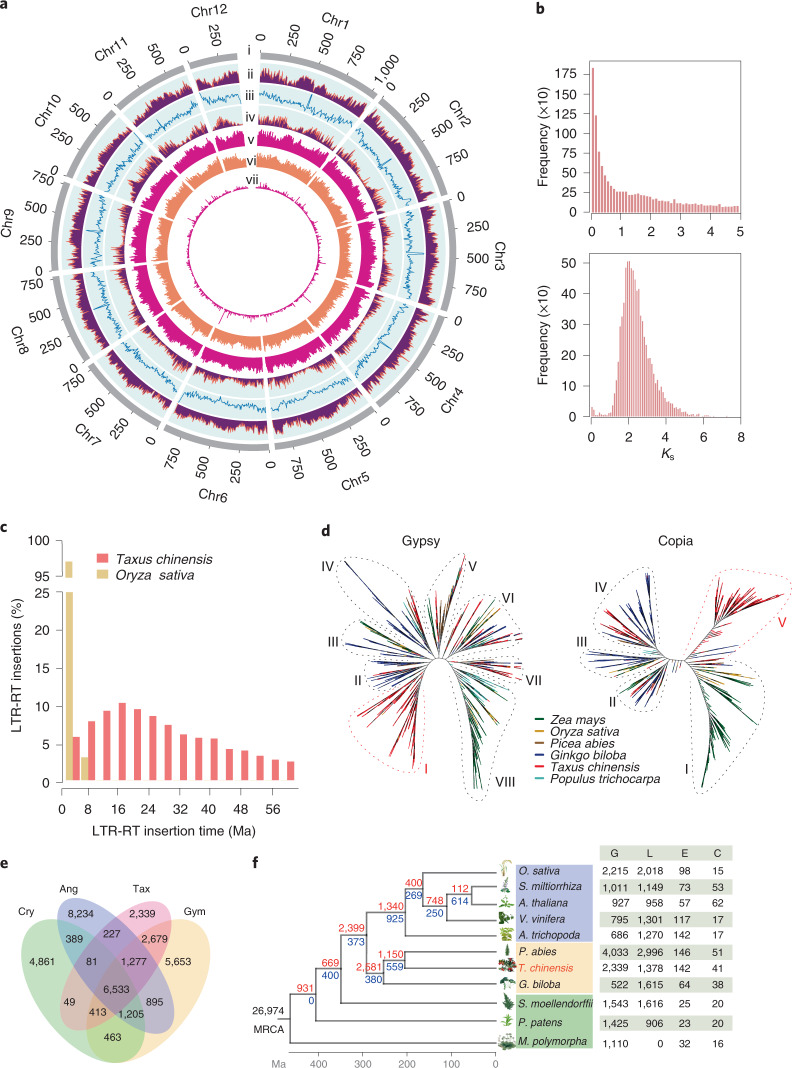
Fig. 1. Genomic features of T. chinensis var. mairei.
a, Genomic landscape of the 12 assembled pseudochromosomes. Track i represents the length of the pseudochromosomes (Mb); ii–iv represent repeat element density, GC content and distribution of gene density, respectively; and v–vii show the distribution of Ty3/Gypsy, Ty1/Copia and unknown LTRs, respectively. These metrics are calculated in 5 Mb windows. b, WGD analysis based on the substitution rate distribution of paralogues. Top, histogram of the Ks distribution from Taxus paralogues based on an all-to-all blast to total genes. Bottom, Ks distribution of paralogues based on syntenic analysis. The Ks values were calculated using the YN model in KaKs_calculator. c, Expansions and diverse sets of LTR elements in the Taxus genome. The histogram shows distributions of insertion times calculated for LTRs in Taxus and rice, using mutation rates (per base year) of 7.3 × 10⁻¹⁰ for Taxus and 1.8 × 10⁻⁸ for rice. The LTR-retrotransposon (LTR-RT) insertions of T. chinensis var. mairei and Oryza sativa are shown as columns in different colours. d, Heuristic maximum likelihood trees of Ty3/Gypsy (shown as Gypsy) and Ty1/Copia (shown as Copia) from six plant species. The two trees were constructed from amino acid sequence similarities within the reverse transcriptase domains of Gypsy and Copia from six plant species. Gypsy elements are divided into eight families (I–VIII), and Copia contains five families (I–V). The representative plants are shown as coloured lines. e, Venn diagram for orthologous protein-coding gene clusters in cryptogam (Cry), angiosperm (Ang), gymnosperm (Gym) and T. chinensis var. mairei (Tax). The cryptogams include M. polymorpha, Physcomitrella patens subsp. patens and Selaginella moellendorffii. The angiosperms include Amborella trichopoda, V. vinifera, Arabidopsis thaliana, Salvia miltiorrhiza and O. sativa. The gymnosperms include Picea abies and Ginkgo biloba. The number in each sector of the diagram represents the total number of genes across the four comparisons. f, Evolution analysis of gene families in Taxus and selected plants. The red numbers on the branches of the phylogenetic tree indicate the number of expanded gene families, and the blue numbers refer to the number of constricted gene families. The supposed most recent common ancestor (MRCA) contains 26,974 gene families. G, L, E and C in the table at right represent the number of gains, losses, expansions and constrictions in the gene families among 11 plant species.

