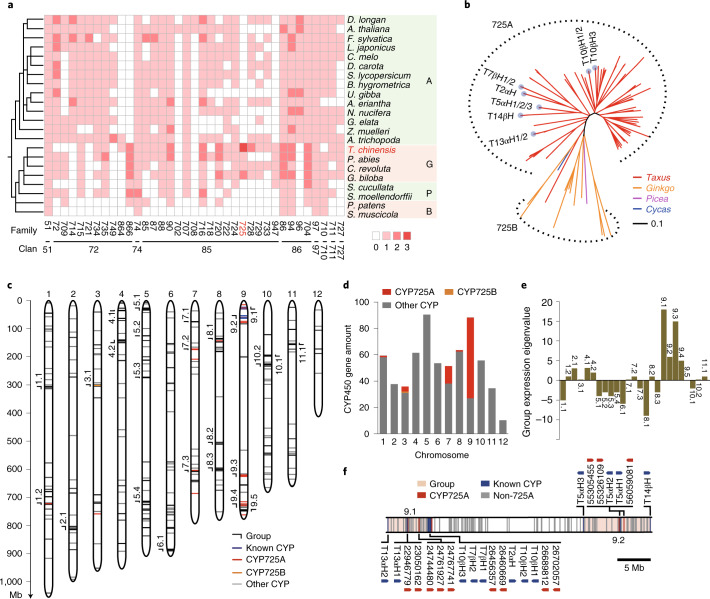
Fig. 2. Evolution and genomic architecture of Taxus CYP450s.
a, Phylogenomic analysis of the non-A-type CYP450s in the representative plant species. A, angiosperms; G, gymnosperms; P, pteridophytes; B, bryophytes. The colour of each block is based on the number of genes in each family, and 0, 1, 2 and 3 indicate that this number ranges from 0, 1–10, 10–50 and 50–100 genes, respectively. b, Phylogenetic analysis of the CYP725 subfamily in T. chinensis var. mairei (Taxus), Ginkgo biloba (Ginkgo), Picea abies (Picea) and C. revolute (Cycas). The dotted outline shows the gene spheres of the CYP725A and CYP725B subfamilies. The light blue dots on the ends of the phylogenetic branches represent the known paclitaxel pathway CYP725A genes and their homologues. The neighbour-joining tree was constructed by Interactive Tree Of Life (iTOL) software. The evolutionary distances were analysed by the p-distance method, and the branch lengths were scaled by the bar. c, Distribution of CYP450 genes on the 12 pseudochromosomes in Taxus. Each short line on the pseudochromosomes represents a CYP450 gene. CYP725As, CYP725Bs and the other CYP450s are marked by red, orange and grey lines, respectively. The known CYP450s in the paclitaxel biosynthesis pathway (known CYP) are shown in blue. The CYP450 groups (≥7 CYP450 genes and ≤5.26 Mb of gene spacing between two adjacent CYP450s) are labelled outside of the corresponding positions on the pseudochromosomes. d, Histogram of the number of CYP450 genes on each pseudochromosome. The CYP725 genes (shown in red and orange) were mainly distributed on pseudochromosome 9, while the other CYPs (shown in grey) were distributed randomly on 12 pseudochromosomes. The y axis represents the number of CYP450 genes. e, Group-based gene expression profiles in response to methyl jasmonate (MeJA) treatment. RNA sequencing analysis was performed with the low-paclitaxel-yielding cell line (LC) treated with 100 μM MeJA for 4 h. The expression of the gene group was calculated by the sum of the expression levels of each CYP450, and each upregulated and downregulated CYP450 was calculated as 1 and −1, respectively, on the basis of their reads per kilobase per million reads values. f, Map of CYP725As located in groups 9.1 and 9.2. The ranges of the gene groups on pseudochromosome 9 are marked in pink. CYP725As and the other genes are marked by red and grey vertical lines, respectively. The known CYP450s in the paclitaxel biosynthesis pathway (known CYP) are shown in blue. The arrows show gene orientations.

