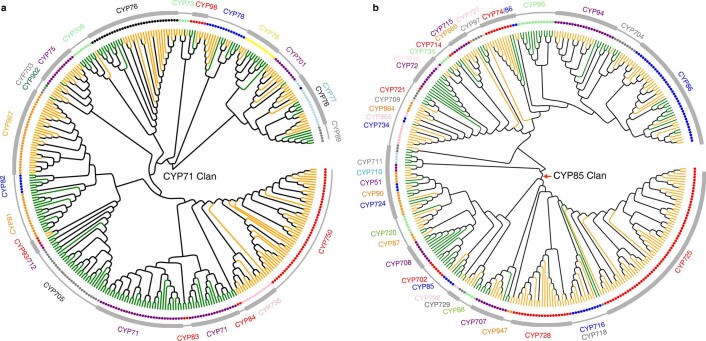
Extended Data Fig. 2. Phylogenic analysis of A-type and non-A-type CYP450 families.
a, Phylogenic analysis of A-type CYP450 families. The green and orange branches indicate the sequences from Arabidopsis and T. chinensis var. mairei, respectively. The dots represent CYP450 genes. The outermost circle indicates the CYP450 gene family. b, Phylogenic analysis of non-A-type CYP450 families. The green and orange branches indicate the sequences from Arabidopsis and T. chinensis var. mairei, respectively. The dots represent CYP450 genes. The outermost circle indicates the CYP450 gene family.

