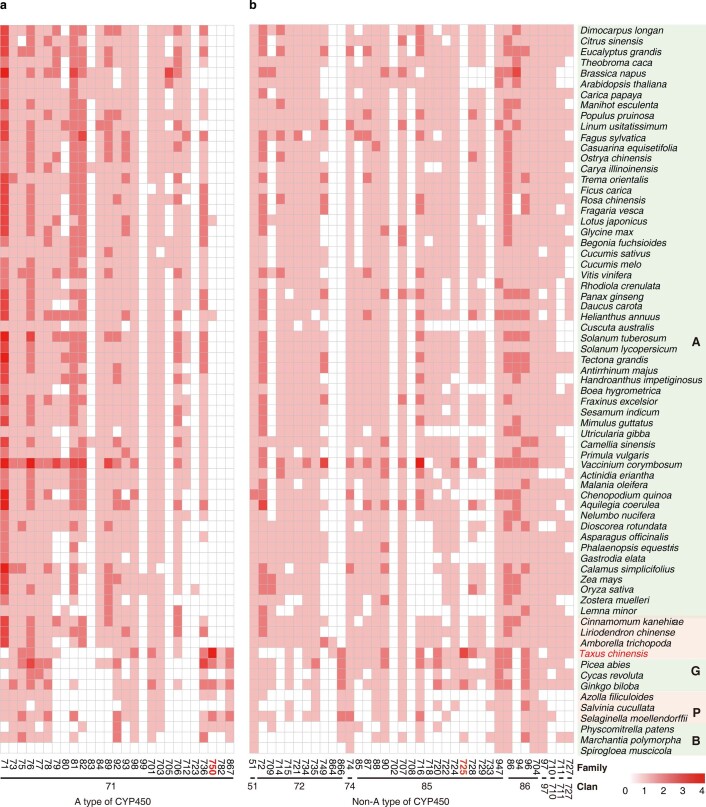
Extended Data Fig. 3. Heat map of the number of CYP450 genes in 69 representative plant species.
Each CYP450 gene family of A-type (a) and non-A-type (b) is represented as a square, with the red color representing the number of genes in the corresponding family. The depth of the red color is divided into five levels, namely, 0, 1, 2, 3, and 4, which correspond to 0, 1–10, 10–50, 50–100, and more than 100 genes, respectively. The family or clan name of CYP450 genes is marked below the heat map. A, Angiosperms; G, Gymnosperms; P, Pteridophytes; and B, Bryophytes.

