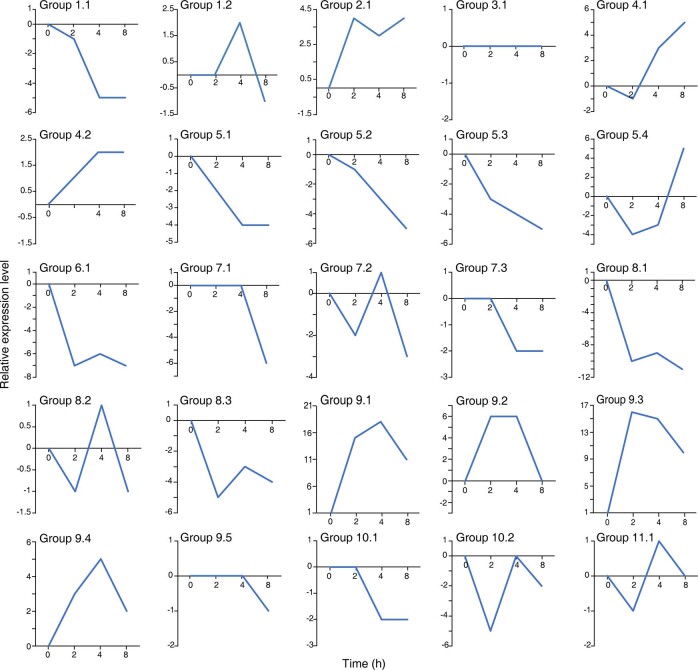
Extended Data Fig. 4. Gene expression in response to MeJA treatment in the Taxus cell line.
Group-based gene expression profiles in response to MeJA treatment. RNA sequencing analysis was performed with the Taxus cell line treated with 100 μM MeJA or 0.5% EtOH solution for 0, 2, 4, and 8 h. The expression of the gene group was calculated by summing the expression levels of each CYP450. Each upregulated and downregulated CYP450 was calculated as 1 and −1, respectively, based on their FPKM (Fragments Per Kilobase of transcript per Million mapped reads) values.

