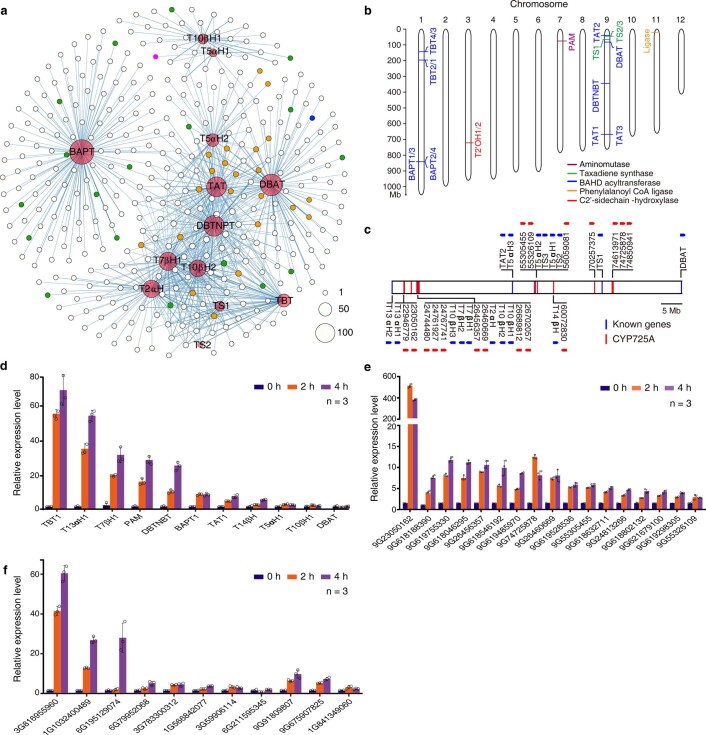
Extended Data Fig. 6. The characteristic of gene expression and location related to the paclitaxel biosynthesis in T. chinensis var. mairei.
a, Co-expression net of paclitaxel biosynthesis genes. The genes with a Pearson correlation coefficient value above 0.75 are displayed on the net. The known paclitaxel biosynthesis genes, CYP725s, CYP450s, and the remaining genes are represented as red, orange, green, and white dots, respectively. The purple and blue dots show the two novel CYP725A genes, 55305455 and 55326109, respectively. The size of the dot correlates with the gene number. b, Genomic location of the annotated genes known to be involved in paclitaxel biosynthesis, except for CYP450s. The different colors of the short lines indicate the different types of annotated genes and their homologs in the paclitaxel pathway; the short purple, green, blue, orange, and red lines correspond to aminomutase, taxadiene synthase, BAHD acyltransferase, ligase, and C2’-sidechain-hydroxylase. c, Defined genes and 18 novel CYP725As on chromosome 9. The known genes in the paclitaxel biosynthesis pathway (known genes) are marked by blue lines, while the unknown CYP725As are shown in red lines. The arrows show gene orientations. d-f, The relative transcript abundance of the eleven defined paclitaxel biosynthetic genes (d), the sixteen CYP725A candidates (e), and the eight TFs and three BAHD acyltransferase genes (f) in MeJA-induced Taxus cell lines by quantitative real-time PCR (qPCR) analysis. The relative gene expression levels are represented as the average fold change (2-ΔΔCt). The Taxus actin 1 gene (7G702435613) was used as an internal reference. Error bars indicate standard errors from three independent biological replicates.

