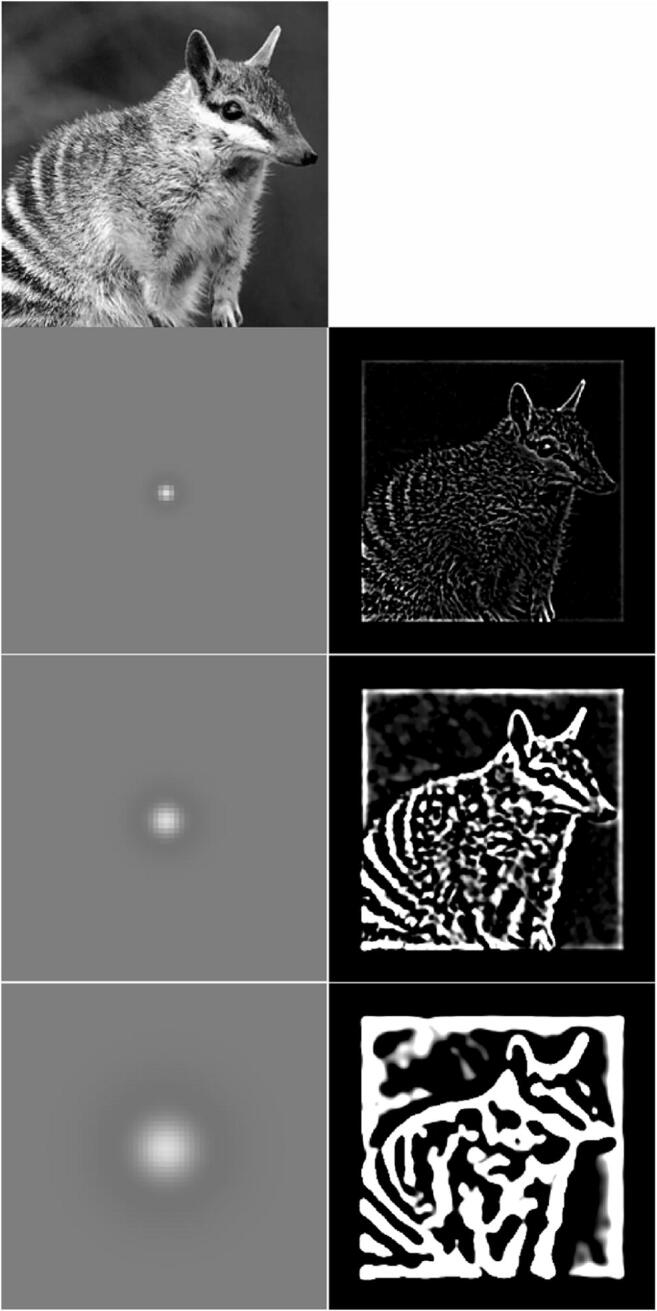
Fig. 2.

Spatial frequency demonstration. The top figure is a photograph of a numbat (an Australian marsupial). The three lower images are the same image, but they are filtered so that they only contain (from top to bottom) high, intermediate, or low spatial frequencies. This filtering was achieved by convolving the top image with the spatial filter shown on the left: a circular difference of Gaussians where bright regions show excitation and darker regions inhibition. The images on the right are normalized to use the full intensity range but they still show that high frequencies carry information about fine-scale edges in preference to information about luminance changes in larger regions, while lower spatial frequencies do the opposite
