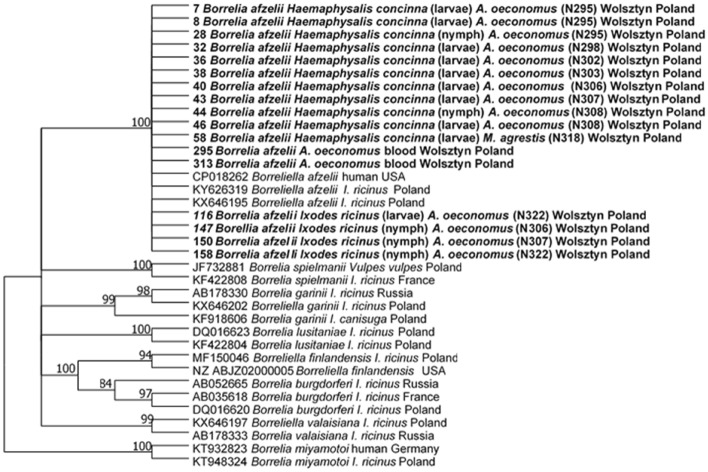
Fig. 1.
Molecular phylogenetic analysis of flaB of Borelia burgdorferi s.l. (605 bp), showing the tree with the highest log likelihood (− 1677.91). The percentage of trees in which the associated taxa clustered together is shown next to the branches. This analysis involved 36 nucleotide sequences. All positions containing gaps and missing data were eliminated (complete deletion option). In total, there were 529 positions in the final dataset

