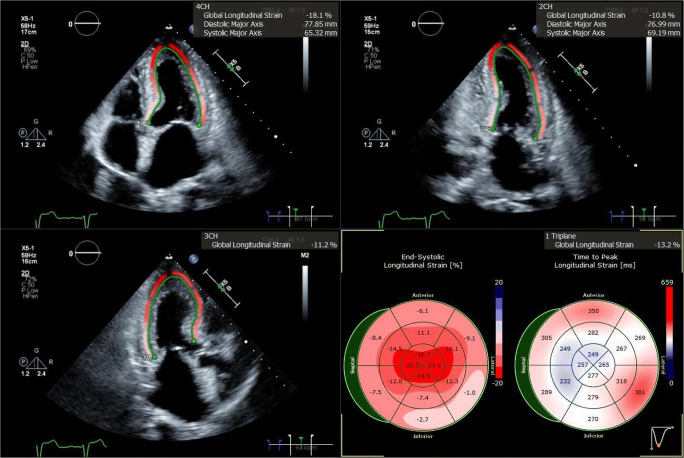
Fig. 3.
Three standard views of the heart are shown, as imaged from the LV apex. The green contours demonstrate calculation of global longitudinal strain (GLS). GLS values are color coded, with bright red reflecting normal longitudinal strain, while dark and lighter shades of pink indicate reductions in GLS. The apex of the heart is clearly spared, as red contouring is evident at the apical segments in all images, while strain is reduced in the basal and mid ventricular segments. The lower right quadrant shows a bull’s eye graph of the left ventricle divided into 16 segments; the preservation of healthy longitudinal strain at the apex results in a “cherry on top” pattern, pathognomonic for cardiac amyloidosis

