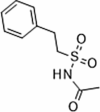
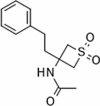
Table 3.
The top three compounds in terms of largest error (SM43, SM42 and SM36) and lowest error (SM26, SM37 and SM28) for model 12_Full
| Structure | ID | Experimental | Model _Full | TFE MLR | COSMO-RS |
|---|---|---|---|---|---|

|
SM43 | 0.85 ± 0.01 | 2.51 ± 0.10 | 0.38 | 2.59 |

|
SM42 | 1.76 ± 0.03 | 3.16 ± 0.05 | 1.57 | 3.48 |

|
SM36 | 0.76 ± 0.05 | 2.05 ± 0.10 | 2.63 | 2.29 |

|
SM37 | 1.45 ± 0.10 | 1.36 ± 0.11 | 1.44 | 1.72 |

|
SM26 | 1.04 ± 0.01 | 1.11 ± 0.06 | 1.18 | 1.22 |

|
SM28 | 1.18 ± 0.08 | 1.03 ± 0.06 | 1.87 | 0.65 |
