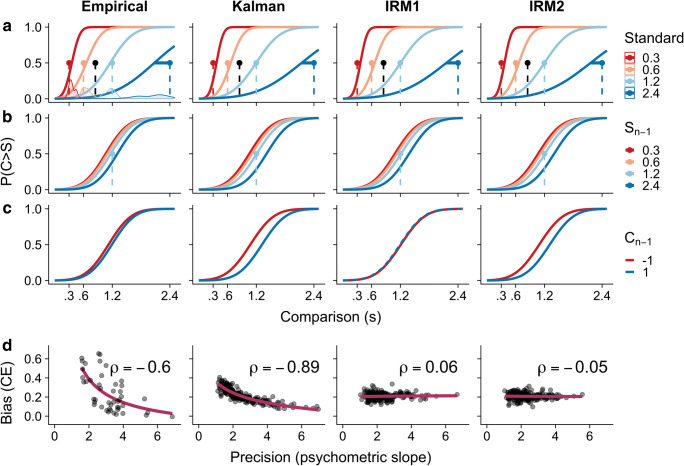
Fig. 2.
Fitted psychometric curves for empirical data and each model. a The effect of current standard on bias. Dashed lines and dots represent the standard durations and geometric mean, which is connected with a horizontal line to the point-of-subjective-equality (PSE). Density plots represent the subject-to-subject variability in PSE estimates for each standard duration. For psychometric curves, the x-axis represents the comparison duration and the y-axis represents probability of ‘C longer’ response. b Statistical estimates for the effect of Sn−1 on PSE, plotted for Sn = 1.2 s. c Statistical estimates for effect of Cn−1 on PSE, where ‘−1’ indicates that Cn−1 was twice as short as Sn−1 and ‘1’ indicates that it was twice as long. These values for Cn−1 were chosen for illustrative purposes, since absolute values of Δd varied between participants, but absolute values of Δd were constrained to be less than or equal to 1. Also, these values ensure that these plots are on a similar scale as those for Sn−1. d Estimated subject-to-subject Spearman correlation coefficients (ρ) from GLMs between bias (constant error; coefficient for Sn) and precision (psychometric slope; coefficient for Δd). To demonstrate the functional form of this relationship, red lines are fitted power functions. (Color figures online)

