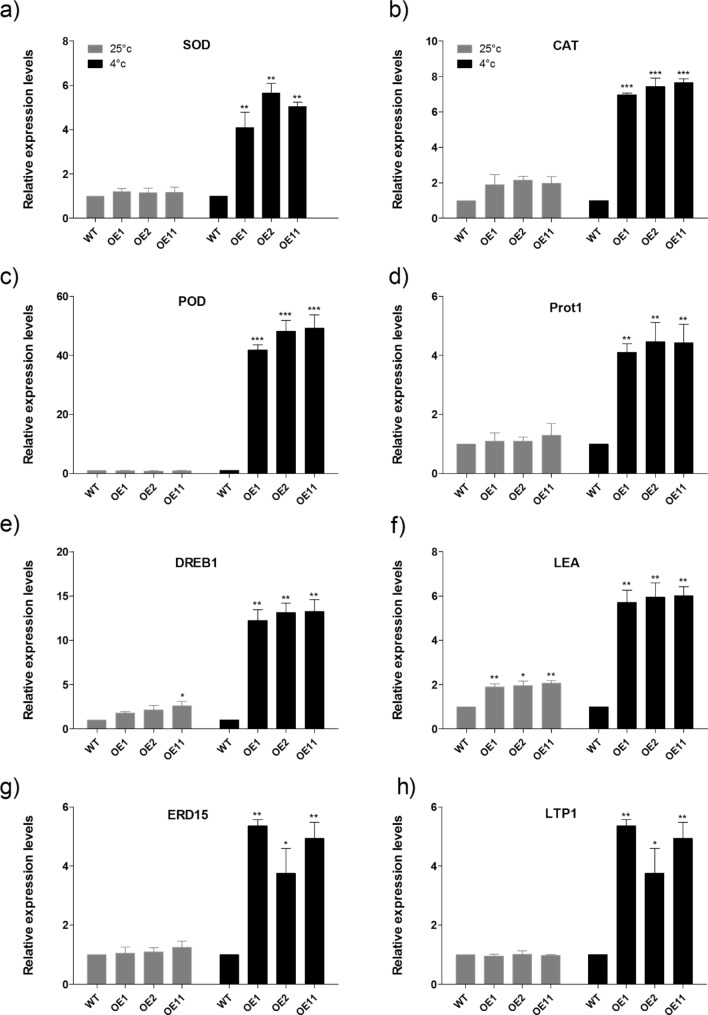
Figure 7.
Expression levels of stress responsive genes in wild-type and BoCRP1 transgenic lines. (a–h) depicts the transcript levels of SOD, POD, CAT, ProT1, DREB1, LTP1, ERD15-2 and LEA in wild-type and BoCRP1 overexpression lines. Six week old seedlings of transgenic lines and wild-type plants treated with cold (4 °C) or 25 °C (control) for 3 days were used to collect the samples for RNA extraction. For relative expression levels, 2−∆∆CT method was employed using β-Tubulin as internal control to normalize the expression levels of target genes. Data represents the mean ± SD of three biological replicates. Each sample replicate composite of leaves was collected from a total of 12 seedlings. WT represents the wild-type tomato, OE1, OE2 and OE3 represent three independent putative BoCRP1 transgenic tomato lines. Asterisks represents the significant differences between wild-type and transgenic lines. *P < 0.05; **P < 0.01, ***P < 0.001 Tukey's Multiple Comparison Test.

