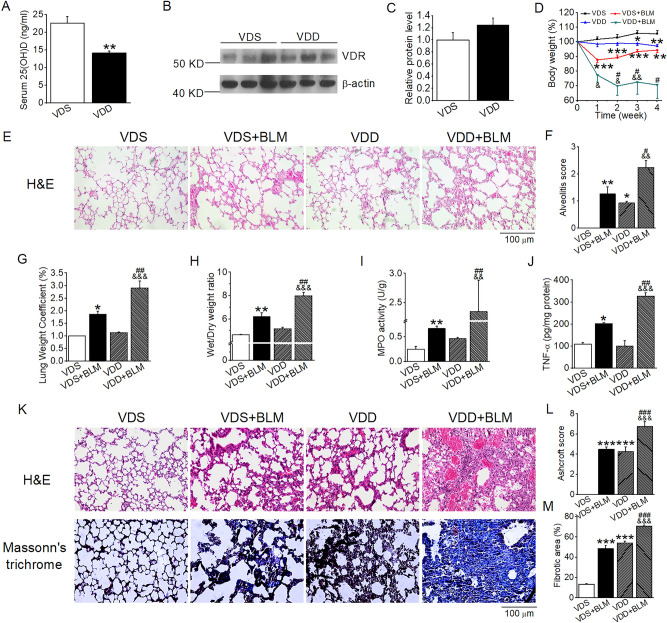
Figure 3.
Vitamin D deficiency exacerbates BLM-induced structural damage and lung fibrosis in mice. (A) Serum 25(OH)D levels in mice fed VDS or VDD diets for 9 weeks. **P < 0.01, versus VDS group. n = 5 each group. (B,C) Western blot analysis (B) and densitometric quantitation (C) of pulmonary vitamin receptor (VDR) in VDS and VDD mice. n = 6–7 each group. (D) Mouse body weight changes in the course of 4 weeks after BLM induction. *P < 0.05, **P < 0.01, ***P < 0.001, versus VDS group; &P < 0.05, &&P < 0.01 versus VDD group; #P < 0.05, versus VDS + BLM group; by two-way repeated measures ANOVA. n = 5–6 each group. (E) H&E staining of the lung sections 2 weeks after BLM induction. Original magnification: 200×. (F) Alveolitis scores of the lung sections. (G) Lung weight coefficient. (H) Wet/dry weight ratio. (I) TNF-α levels in lung lysates. (J) Myeloperoxidase (MPO) levels in lung lysates. *P < 0.05, **P < 0.01, versus VDS group; &&P < 0.01, &&&P < 0.001 versus VDD group; #P < 0.05, ##P < 0.1 versus VDS + BLM group; by two-way ANOVA. n = 3–4 each group. (K) H&E and Masson’s trichrome staining of lung Sects. 4 weeks after BLM induction. Original magnification: 200×. (L) Microscopic scores of lung sections according to Ashcroft’s method. (M) Quantification of Col-positive areas based on Masson’s trichrome staining. ***P < 0.001, versus VDS group; &&&P < 0.001, versus VDD group, ###P < 0.001, versus VDS + BLM group; by Kruskal–Wallis one-way ANOVA. n = 4–6 each group.

