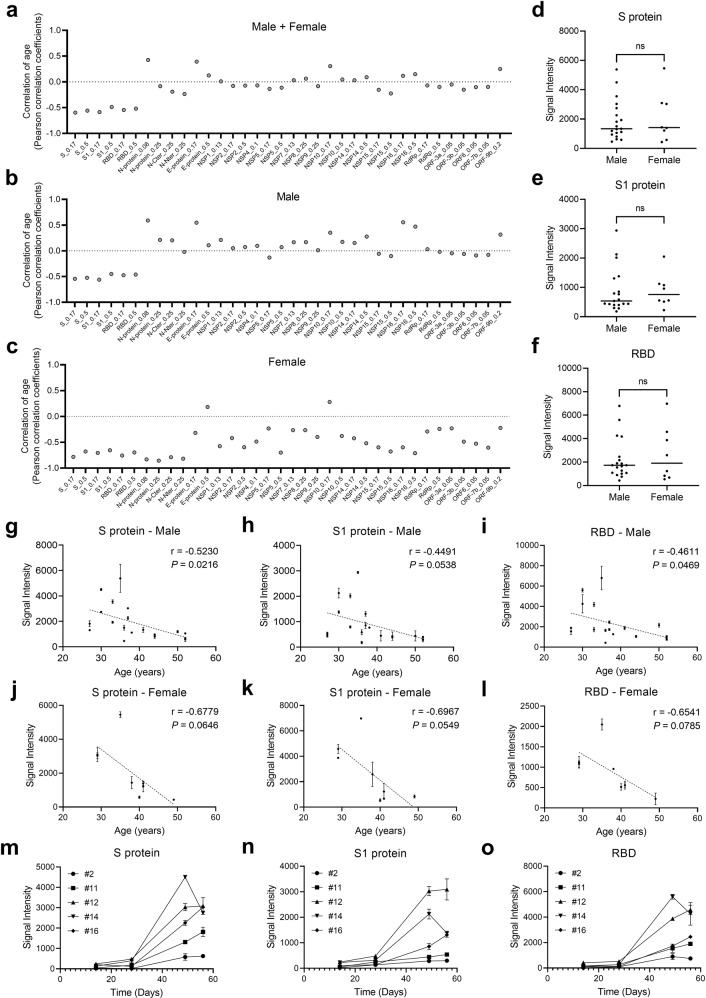
Fig. 2. Correlation of protein (S, S1, or RBD)-specific IgG responses to age or gender.
a Correlations of the overall IgG responses to age. b, c Correlations of IgG responses to age for males (b) and females (c). d–f IgG responses of males vs females to the S protein (d), S1 subunit (e), and RBD (f). The P value were calculated by the Student’s t-test. g–l Correlations of IgG responses to age for males and females for individual proteins, i.e., the S protein (g) and (j), S1 subunit (h) and (k), and RBD (i) and (l). m–o Trends of IgG responses to the S protein (m), S1 subunit (n), and RBD (o). Values are presented as the mean ± SEM. Unless otherwise stated, sera collected after the 2nd vaccine dose were analyzed.

