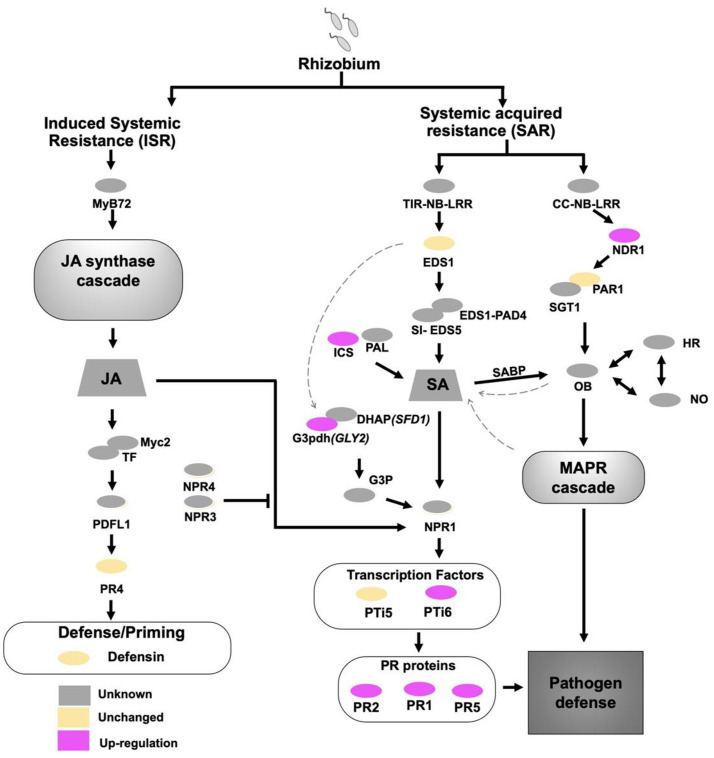
Figure 5.
A schematic representation of how salicylic acid triggered the plant immune pathway in Vigna radiata cv. KPS1. This representation is based on the gene expression (qRT-PCR) comparison between USDA110 and 110nopE1E2 inoculation: grey colour (unknown), yellow colour (the gene expression was not different between USDA110 and 110nopE1E2 inoculation), and pink colour (the gene expression of 110nopE1E2 inoculation was significantly higher than that of USDA110 inoculation). Significance at P < 0.05 is indicated by the means ± standard deviations (n = 3).

