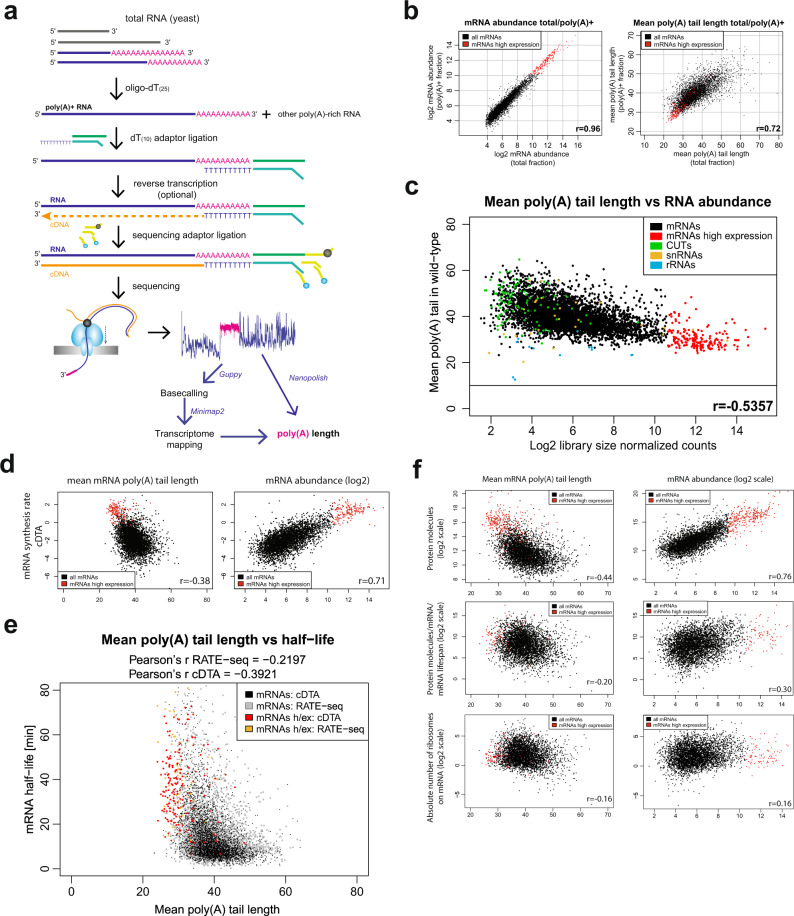
Fig. 1. RNA poly(A) tail length anticorrelates with RNA expression.
a Schematic diagram of the DRS technique used to estimate poly(A) tail lengths. The poly(A)+ fraction is isolated from total RNA; then libraries are prepared according to the protocol, with the first step of (dT)10 adapter ligation. After sequencing bioinformatic analysis steps are performed: basecalling, mapping to transcriptome, and estimation of the length of the poly(A) tail (marked in pink) by Nanopolish using a raw signal readout. b Scatterplots showing in the left panel the comparison of log2 mRNA abundance in DRS libraries prepared using the poly(A)+ fraction or total sample and in the right panel the mean poly(A) tail length estimates in both library types. c Relationship between RNA abundance and the mean poly(A) tail length of different RNA biotypes, averaged from three independent WT control datasets (two from W303 and one from BY genetic backgrounds, each composed of a minimum of two biological repeats). The cutoff line shows the limit of the efficient DRS poly(A) tail estimation method (10 A). d Relationship between DRS-defined mean poly(A) tail length (left panel) and log2-scaled mRNA abundance (right panel) relative to log2-scaled mRNA synthesis rate from cDTA dataset36. e Relationship between mean mRNA poly(A) tail length and transcripts half-life from cDTA or RATE-seq datasets34,36. “h/ex” in the key designates highly expressed mRNAs, which are marked in red (for cDTA) or orange (for RATE-seq). f Relationship between mean poly(A) tail length (left panels), log2-scaled mRNA abundance (right panels), the log2-scaled number of protein molecules per cell37 (upper panels), the log2-scaled number of protein molecules that are produced from a given transcript during its lifespan (middle panels) and log2-scaled raw ribosome occupancy estimation (bottom panels; factor b and w from Siwiak and Zielenkiewicz38). Pearson’s correlation coefficients are indicated on each scatterplot.

