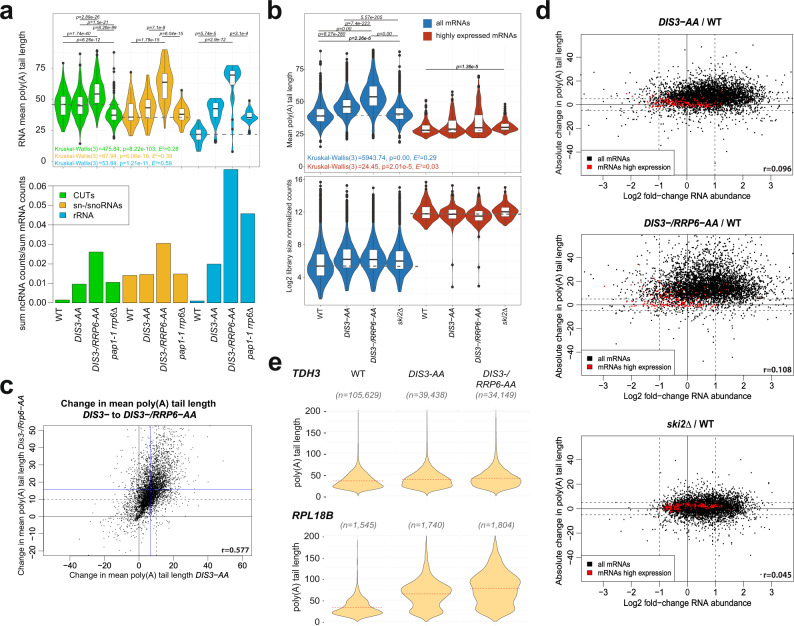
Fig. 4. Dis3 and Rrp6 mediate extensive mRNA poly(A) tail trimming.
a Violin plot of mean poly(A) tail lengths of CUTs, snRNAs, and rRNAs detected in WT, DIS3-AA, DIS3-/RRP6-AA, and pap1-1 rrp6Δ cells (top), and the sum of all DRS counts that map to those ncRNA loci, normalized to the sum of counts mapped to protein-coding loci (bottom). The number of RNAs detected n = [WT, Dis3-AA, Dis3-/Rrp6-AA, pap1-1 rrp6∆] was for CUTs = [143, 436, 579, 434], sn/snoRNAs = [36, 52, 59, 59], and rRNAs = [17, 23, 24, 23]. For the upper panel, Kruskal–Wallis test P value and Holm-corrected P values for two-sided Dunn pairwise test are shown. Dashed gray lines show the mean values for WT strain to ease visual comparison. Box plots show median value (solid bold line) and 1st and 3rd quartiles, whiskers represent 1.5 × IQR (interquartile range). Outliers are marked as black points. b Mean mRNA poly(A) tail lengths (top panel), and log2 mRNA abundance (bottom) for WT (n = 5079), DIS3-AA (n = 5035), DIS3/RRP6-AA (n = 5109) and ski2Δ (n = 5081) strains. Data for highly expressed mRNAs are shown in red. For the upper panel, Kruskal–Wallis test P value and Holm-corrected P values for two-sided Dunn pairwise test are shown. Dashed gray lines show the mean values for WT strain to ease visual comparison. Box plots show median value (solid bold line) and 1st and 3rd quartiles, whiskers represent 1.5 × IQR (interquartile range). Outliers are marked as black points. c Relationship between absolute change in mean poly(A) tail length between DIS3- and DIS3-/RRP6-AA cells compared with WT. Blue lines designate the mean poly(A) tail length change in each strain. Dashed lines mark a 10-adenosine change of mean poly(A) tail length. d Relationship between absolute change in mean mRNA poly(A) tail length and log2 fold-change mRNA abundance for DIS3-AA, DIS3-/RRP6-AA, and ski2Δ cells, respectively, compared with WT. Dashed lines show a twofold change in expression and a 5-adenosines change of poly(A) tail length. e Violin plots of the poly(A) tail length distribution of DRS reads for TDH3 and RPL18B mRNAs for WT, DIS3-AA, and DIS3-/RRP6-AA. The number of DRS reads for each condition is shown for each transcript. Red dashed lines show the mean for each condition. Pearson’s correlation coefficients are indicated on each scatterplot.

