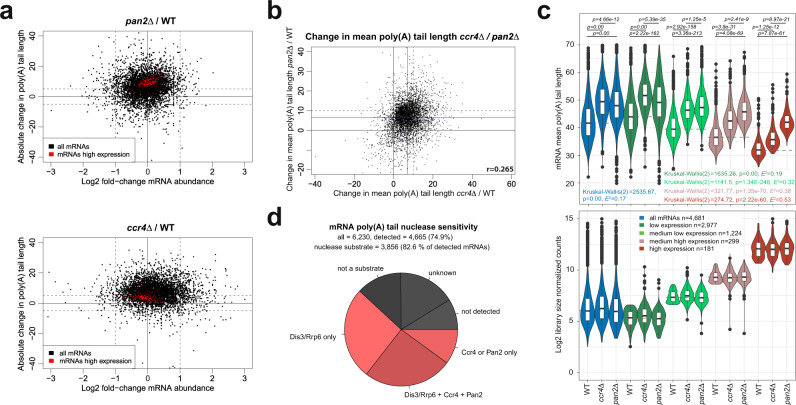
Fig. 5. PAN2/3 and CCR4-NOT cytoplasmic deadenylase complexes can target distinct sets of transcripts.
a Relationship between log2 fold change in mRNA abundance and absolute change in mean poly(A) tail length for pan2Δ (top) and ccr4Δ (bottom) strains relative to WT. Dashed lines show a twofold change in expression and a 5-adenosine change of mean poly(A) tail length. b Relationship between absolute change in poly(A) tail length in ccr4Δ cells relative to WT compared with an absolute change in poly(A) tail length relative to WT for pan2Δ. Blue lines designate the mean poly(A) tail length change in each strain. Dashed lines mark a 10-adenosine change of mean poly(A) tail length. c The violin plot in the top panel shows the distribution of mean poly(A) tail lengths of detected mRNAs, binned by expression level in WT. The bottom panel shows log2-scaled mRNA abundance. The sum of counts from each mRNA category is indicated. Statistical significance for each expression group was calculated using the Kruskal–Wallis test P value and Holm-corrected P values for the two-sided Dunn pairwise test. Box plots show median value (solid bold line) and 1st and 3rd quartiles, whiskers represent 1.5 × IQR (interquartile range). Outliers are marked as black points. d Pie chart showing in red the fraction of cellular mRNAs that were deadenylated by only the exosome (1643), only CCR4-NOT and/or PAN2/3 (625), or all three complexes (1588). Out of a total of 6230 annotated mRNAs, 4665 were reproducibly detected. Transcripts that were unaffected or could not be detected by DRS are highlighted in gray.

