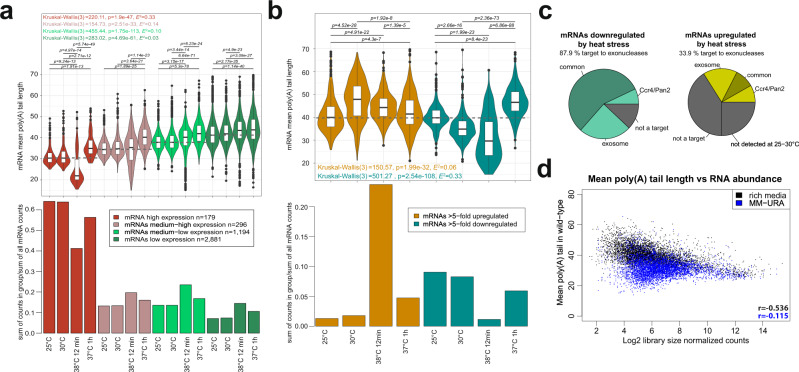
Fig. 6. Transcript poly(A) tail length depends on growth conditions.
a Violin plots in the top panel show the mean poly(A) tail length distribution across mRNAs from wild-type cells that were grown at different temperatures, binned by expression level in WT. The bottom panel shows the fraction of mRNAs DRS counts for each expression bin in a given condition. Box plots show median value (solid bold line) and 1st and 3rd quartiles, whiskers represent 1.5 × IQR (interquartile range). Outliers are marked as black points. b Same as (a) but for mRNAs that were at least fivefold upregulated (orange series) or downregulated (green series) following heat shock. Box plots show median value (solid bold line) and 1st and 3rd quartiles, whiskers represent 1.5 × IQR (interquartile range). Outliers are marked as black points. c Pie charts showing the nuclease sensitivity of heat-regulated mRNAs, which are listed in Supplementary Data 1. d Relationship between mRNA abundance and mean poly(A) tail length for cells that were grown in rich media (black, same as Fig. 1a) and MM-URA (blue) at 25 °C as explained in the main text.

