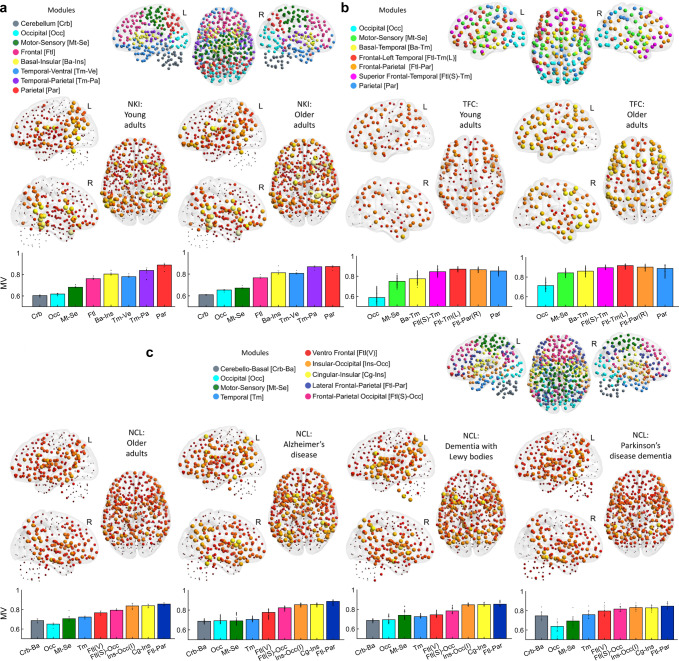
Fig. 3. Modular variability (MV), consensus communities and group means.
a Nathan Kline Institute (NKI) consensus modularity and module definitions shown in coloured spheres (top). Group mean MV for young adult (YA) and older adult (OA) groups (middle). Mean MV per module is shown as bar plots for the OA and YA groups (bottom); colours for each bar match the communities. b Same as (a) but for the 1000 functional connectome (TFC) cohort. c Same as (a) for the Newcastle (NCL) cohort. The left hemisphere (L), right hemisphere (R). Results presented here used the 451-ROI atlas for the NKI and NCL cohorts at optimal edge density; for results using other atlases see Supplementary Fig 5. The mean values and standard deviations shown in the bar plots are obtained by 500 times with bootstrapping approach.

