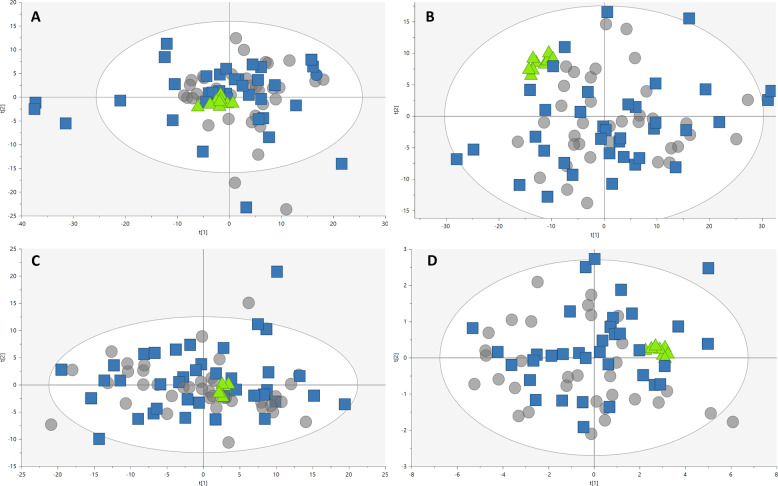
Fig. 2. PCA-X score plot for the three analytical platforms.
AR2 = 0.396 represent the PCA‐X model for LC–MS ESI (+) (UV scaling); B R2 = 0.509 represent the PCA‐X model for LC–MS ESI (−) (UV scaling); C R2 = 0.356 represent the PCA‐X model for CE–MS (UV scaling); and D R2 = 0.691 represent the PCA‐X model for GC–MS (Par-log scaling). The four models showed very good QC clustering, thereby indicating good system stability and reliability of the results (gray circles, pre-PD; blue squares, controls; green triangles, QCs).

