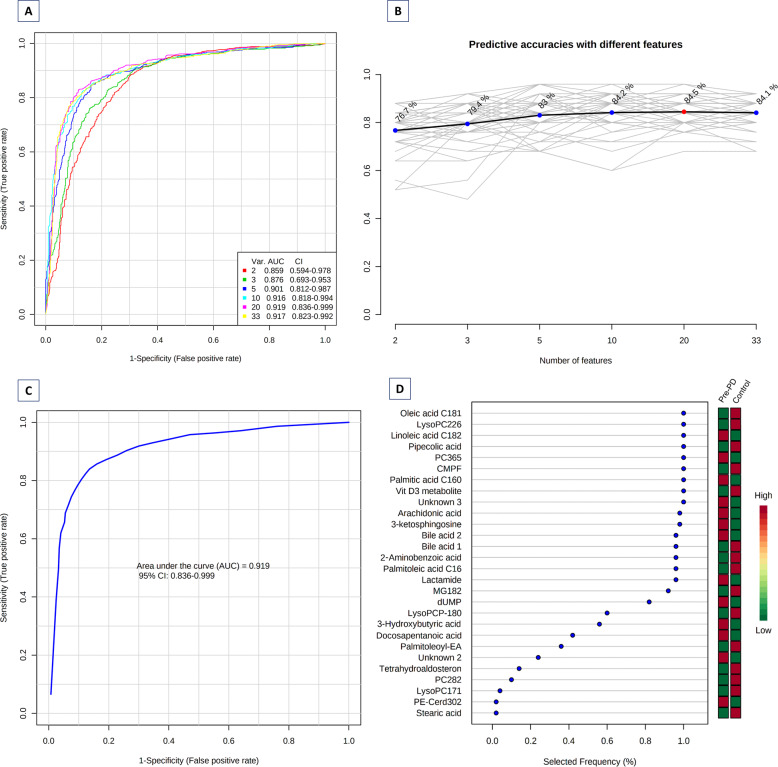
Fig. 5. Biomarker prediction by Multivariate ROC curve based exploratory analysis.
A Overview of all ROC curves created by MetaboAnalyst 4.0 from 6 different biomarker models considering different number of features (2, 3, 5, 10, 20, and 33) with their corresponding AUC value and confidence interval. B Graphic presenting the predictive accuracies of 6 different biomarker models. The red dot specifies the highest accuracy for the 20-feature panel of model 5. C ROC curve for selected biomarker model 5. D Top 28 potential biomarkers predicted based on their frequencies of being selected during cross validation.

