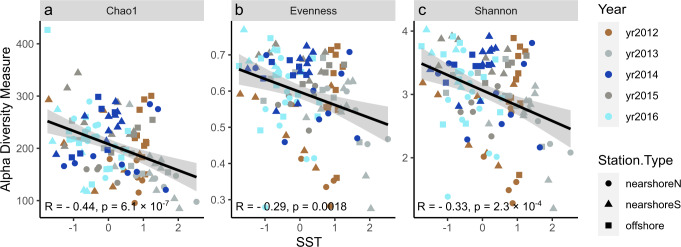
Fig. 4. Alpha diversity indices vs. SST.
Three diversity indices, including Chao1 (a), Pielou’s evenness (b), and Shannon (c), plotted against SST, with year indicated by color and station type indicated by shape. Reads from each sample were rarefied to an even depth. Solid red lines represent linear fittings and the gray bands represent 95% confidence intervals. All three diversity indices show significant negative correlations with SST (two-sided t-test, p < 0.01). Source data are provided as a Source Data file.

