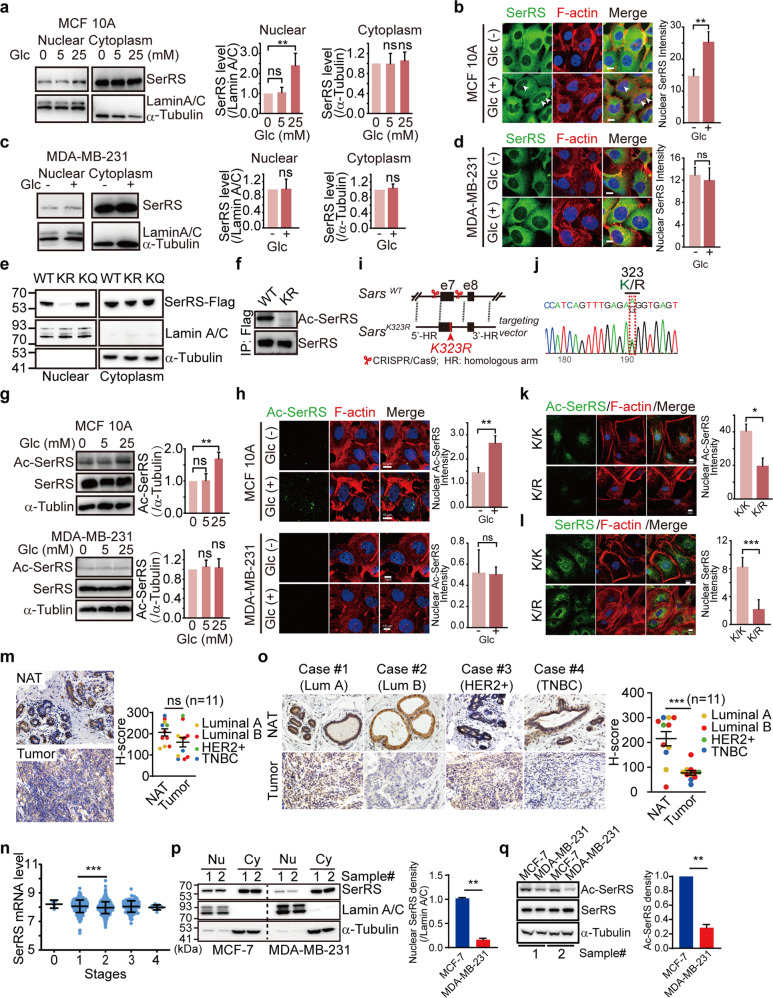
Fig. 1.
Glucose-induced acetylation of SerRS affects its nuclear translocation. a MCF 10A cells were cultured in the medium containing indicated dosages of glucose (Glc) for 24 h and the SerRS in the cytoplasm and nuclear fractions were analyzed by western blot (left panel). Nuclear Lamin A/C and cytoplasm α-tubulin were used to show the purities of nuclear and cytoplasm fractions. Quantification results (right panels) are shown as means ± SEM from three independent experiments (**P < 0.01, ns indicates not significant, by unpaired Student’s t-test). b Immunofluorescent staining to show the subcellular localization of SerRS in MCF 10A cells cultured in absence or presence of 25 mM Glc (scale bars represent 10 μm) and the quantification of nuclear SerRS (means ± SEM from three independent experiments, **P < 0.01, by unpaired Student’s t-test). c, d The nuclear translocation of SerRS in MDA-MB-231 cells cultured in the absence or presence of 25 mM Glc was analyzed by western blot (c) and immunofluorescent staining (d, Scale bars represent 10 μm). The quantification results are shown as means ± SEM from three independent experiments (ns indicates not significant, by unpaired Student’s t-test). e Western blot analysis to show the nuclear translocation of wild type (WT) SerRS and its mutants with Lysine 323 (K323) to arginine (KR) or to glutamine (KQ) mutations. f The specificity of customized antibody against acetylated SerRS at K323 (Ac-SerRS) was tested by western blot analysis on immunoprecipitated Flag-tagged WT and KR SerRS from MCF 10A cells. g, h The SerRS acetylation at K323 was analyzed by western blot (g) or immunofluorescent staining (h) using Ac-SerRS specific antibody in indicated cells cultured in different dosages of glucose. The quantification results are shown as means ± SEM from three independent experiments (**P < 0.01, ns indicates not significant, by two-sides Student’s t-test). In (h), the glucose dosages were 25 mM. Scale bars represent 10 μm. i Knock-in mice bearing Lys323-to-Arg heterozygote mutation (SarsK/R) was generated by CRISPR/Cas9 and homologous recombination of a targeting vector with mutation of K323-encoding sequence. j Validation of Sars knock-in mice with heterozygote Lys323-to-Arg mutation by PCR and sequence analysis. k, l Immunostaining of Ac-SerRS (k) and total SerRS (l) in fibroblast cells isolated from SarsK/R mice. Scale bars represent 10 μm. The quantification results are shown as means ± SEM from three independent experiments (*P < 0.05, ***P < 0.001, by two-sides Student’s t-test). m Immunohistochemistry staining of SerRS in human breast cancer tissues and normal adjacent tissues (NAT) (left panels) and the quantification (right panel, means ± SEM, ns indicates not significant, by paired Student’s t-test). n Comparison of the SerRS mRNA levels in different stages of breast cancers (means ± SD, ***P < 0.0001, by unpaired Student’s t-test). Data were collected from TCGA data base. o Immunohistochemistry staining of Ac-SerRS in human breast cancer tissues and normal adjacent tissues (NAT) and the quantification (means ± SEM, ***P < 0.0001, by paired Student’s t-test). p Western blot analysis of nuclear (Nu) and cytoplasmic (Cy) SerRS in indicated breast cancer cell lines and the quantification (means ± SEM from two independent experiments, **P < 0.001, by unpaired Student’s t-test). q Western blot analysis of lysine 323-acetyated SerRS in indicated breast cancer cell lines and the quantification (means ± SEM from two independent experiments, **P < 0.001, by unpaired Student’s t-test)

