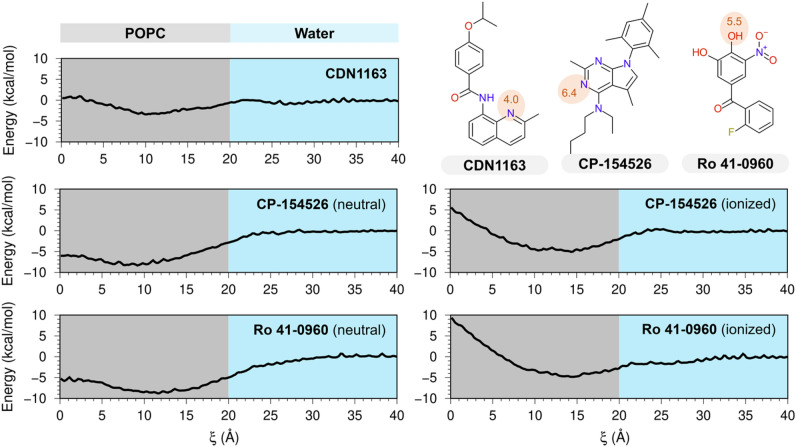
Figure 2.
Bilayer-crossing free energy profiles of SERCA2a activators. Profiles are represented by the potential of the mean force (PMF) of SERCA2a activators CDN1163, CP-153526, and Ro 41-0960 along the normal z-axis of a POPC membrane; the distance along the z-axis was used here as a reaction coordinate (ξ). The chemical structures in the upper right indicate the location of titratable groups and their corresponding pKa values (red circles); based on these pKa values, Bilayer-crossing free energy profiles were calculated for either neutral or ionized states of the small molecules. The gray area illustrates only one leaflet of the lipid bilayer.

