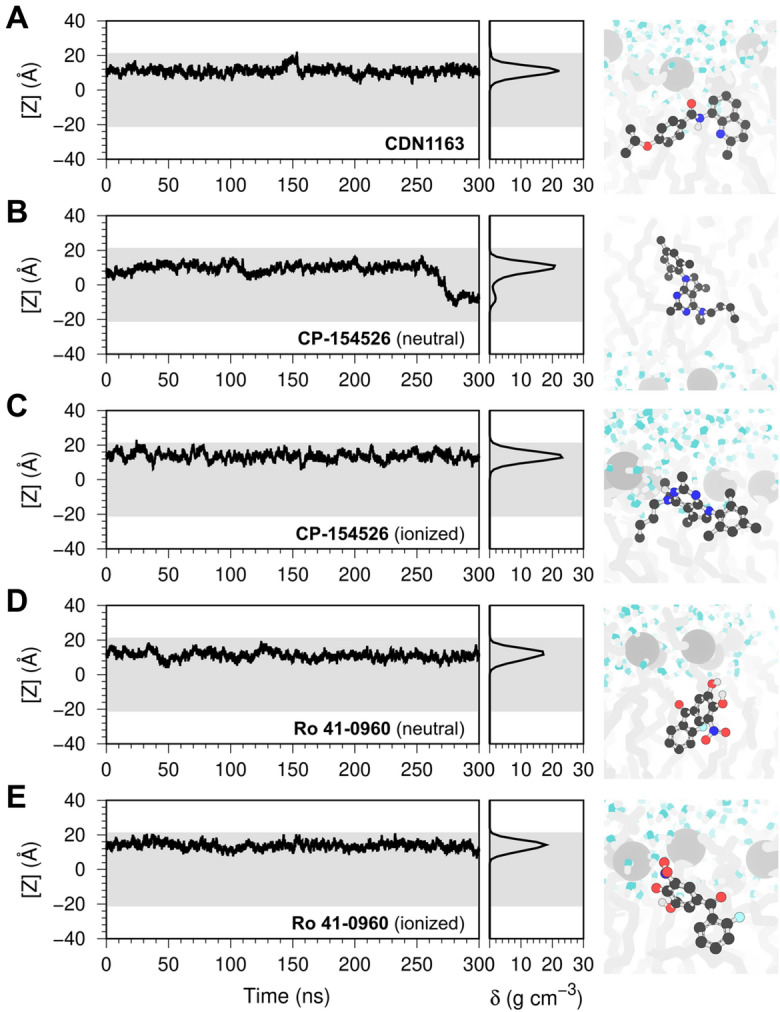
Figure 3.

Single-molecule atomistic simulations of ligand–membrane interactions. The plots represent the position of a single molecule of (A) CDN1163, (B,C) CP-154526, and (D,E) Ro 41-0960 bound to a solvated POPC membrane. We show the time-dependent position of the molecule along the z-axis of the lipid–water system (left), the relative density (δ) profile of the molecules in the lipid bilayer (center), and the orientation of the molecules in the lipid bilayer extracted at the end of the trajectories (right). In all plots, the shaded area represents the location of the lipid bilayer. The small molecules are shown as ball and stick representation; lipid headgroups and tails are shown as light gray spheres and sticks, respectively; water molecules are shown as white and blue sticks.
