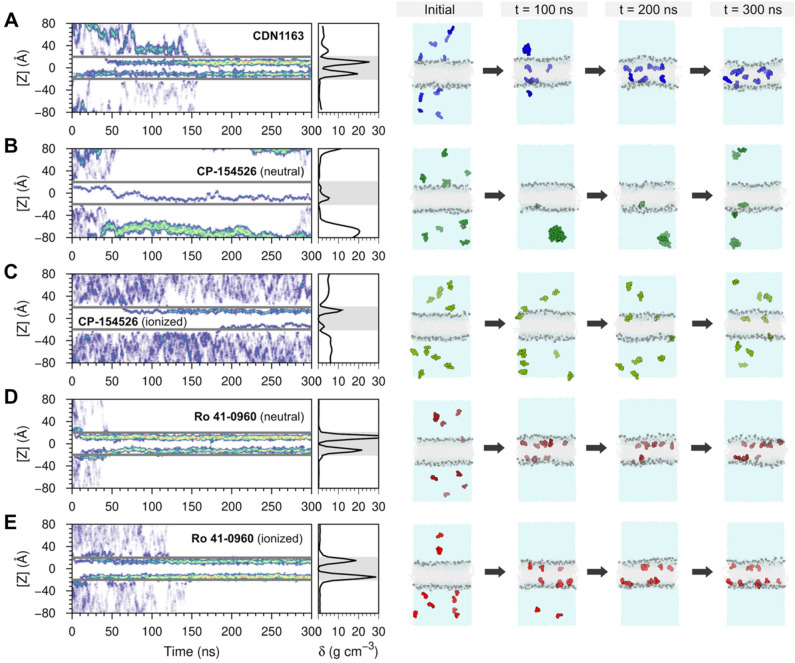
Figure 4.
Ensemble-based atomistic simulations of ligand–membrane interactions of SERCA2a activators. The left panels show the time-resolved behavior of SERCA2a activators in a lipid–water environment and the relative density profiles of SERCA2a activators in a lipid–water system obtained from the ensemble-based MD simulations. The figure shows the position of the molecules relative to the z-axis of the system (left) and the relative density (δ) profile (right) calculated for (A) CDN1163, (B,C) CP-154526, and (D,E) Ro 41-0960. The gray horizontal lines (left) and the shaded area (right) represent the boundaries of the lipid bilayer. We show time-dependent configurations of each system containing a solvated membrane and ten copies of each SERCA2a actiator. The simulations capture spontaneous insertion of small molecules into the membrane as well as ligand–ligand interactions during the 300 ns of simulation time. CDN1163 (blue), CP-154526 (green), and Ro 41-0960 (red) are shown as spheres; lipids and water molecules are shown in gray and blue, respectively.

