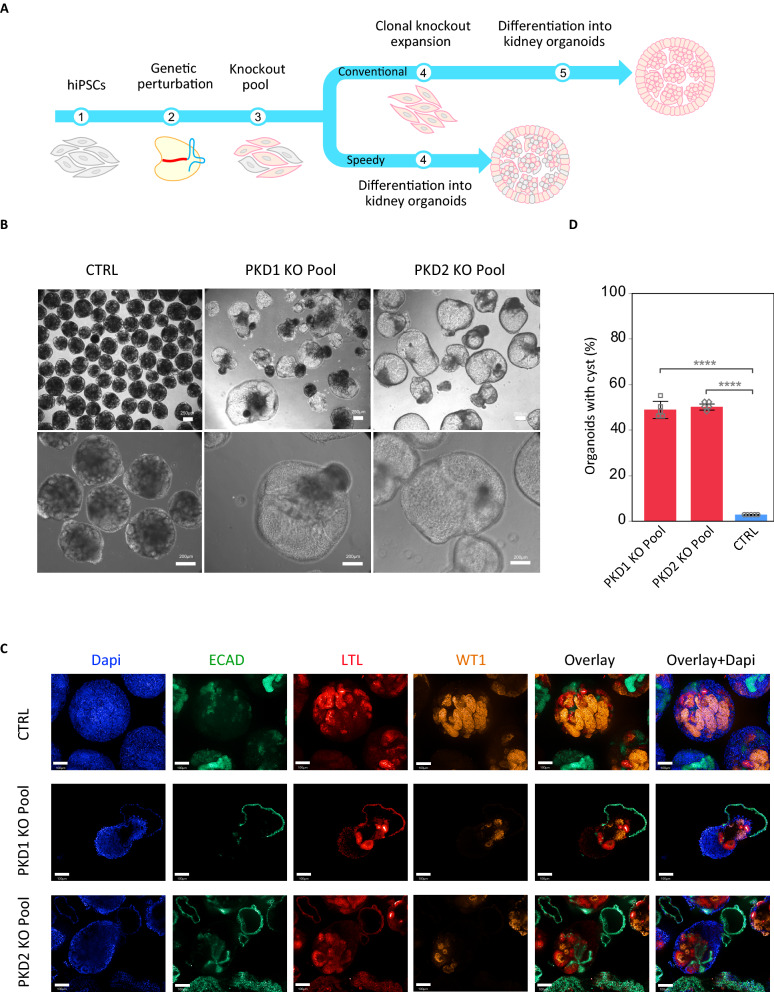
Figure 4.
Cystic phenotype in kidney organoids using genetic perturbation. (A) Schematic outline of differentiation stages for conventional clonal knockout isolation and differentiation and speedy/direct differentiation of KO pools. (B) Cystic phenotype observed in organoids obtained from genetic perturbation of PKD1 and PKD2. (C) The resulting kidney organoids were stained and imaged using confocal microscopy for different markers. (D) Quantification of cyst formation rates in PKD KO pool organoids versus isogenic unmodified organoids (CTRL) as an average of all experiments. Data are shown as Mean. Bar represent standard deviation (SD) (n = 5 separate experiments).

