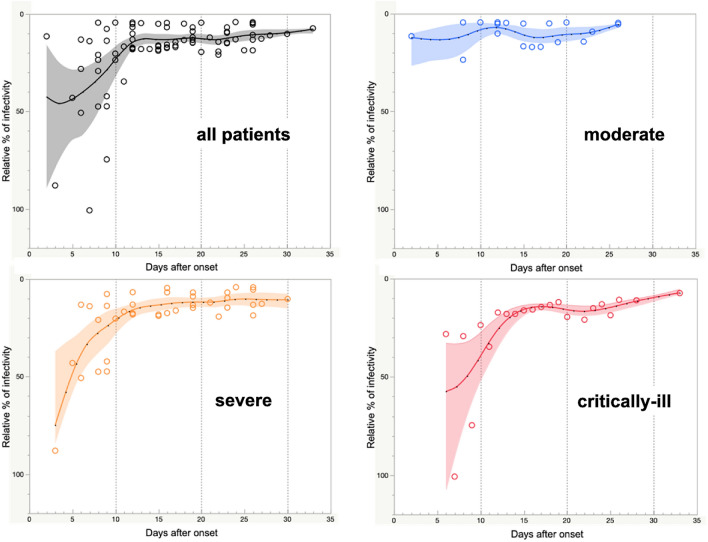
Figure 1.
Trends in neutralization activities in symptomatic patients stratified by severity. Nonlinear regression models of all eleven patients (black), four moderate (blue), six severe (orange), and one critically ill patients (red). The models were calculated using the mean data of three independent assays of the patients stratified by severity. Solid curves are spline curves fitted to the mean with a λ of 0.05. Shading indicates the 95% confidence interval of each model.

