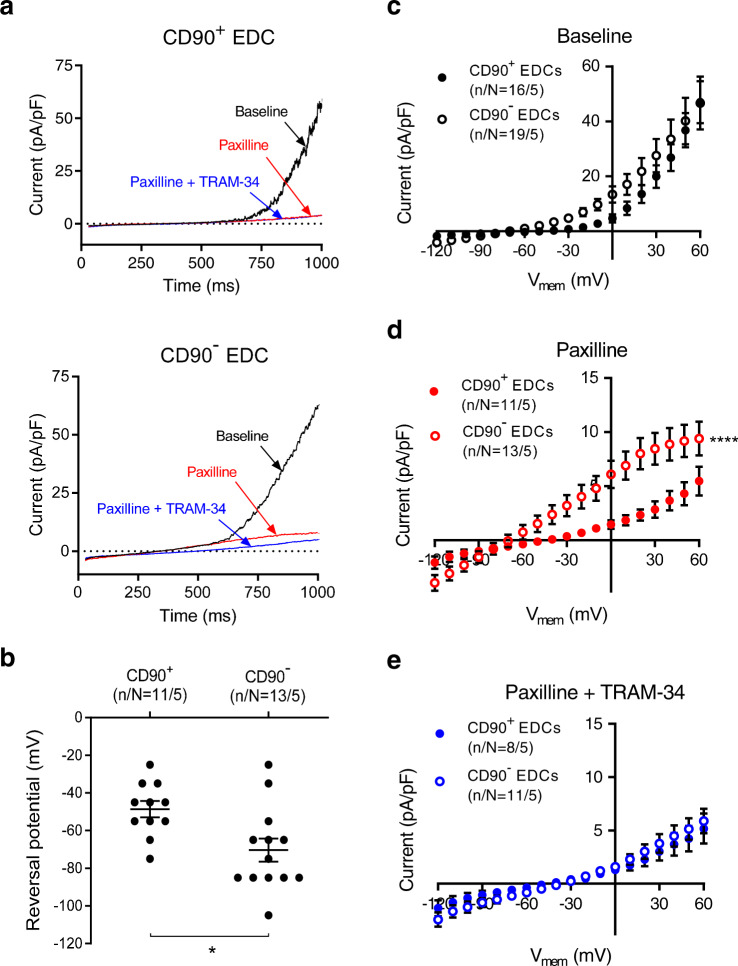
Fig. 1. Endogenous ion currents expressed in human EDCs.
a Original whole-cell currents from CD90+ (upper panel) and CD90− EDCs (lower panel) under various experimental conditions, with a 1000-ms depolarizing voltage-ramp protocol from −120 to +60 mV, with a holding potential of −40 mV, before and after the addition of KCa inhibitors. Baseline = black, paxilline = red, paxilline + TRAM-34 = blue. b Reversal potential of whole-cell ion currents recorded in CD90+ and CD90− EDCs in the presence of 300 nmol/L free-[Ca2+]i. c–e I–V relationship of whole-cell ion currents (recorded with 1000 ms voltage-ramps from −120 to +60 mV with a holding potential of −40 mV) in CD90+ and CD90− EDCs under c basal conditions, d after addition of 1 µmol/L paxilline, or e after addition of 1 µmol/L paxilline and 1 µmol/L TRAM-34. Open circles = CD90−, closed circles = CD90+. Two-sided non-paired student t-test (panel b); two-way repeated-measures ANOVA showing significance of group effect; n/N = cells/cell lines per group. EDC explant-derived cell. Data in b–e are shown as individual data points along with mean and SEM. *P < 0.05; ****P < 0.0001 vs CD90− EDCs. For precise P values, see Supplemental Source Data and Statistics file.

