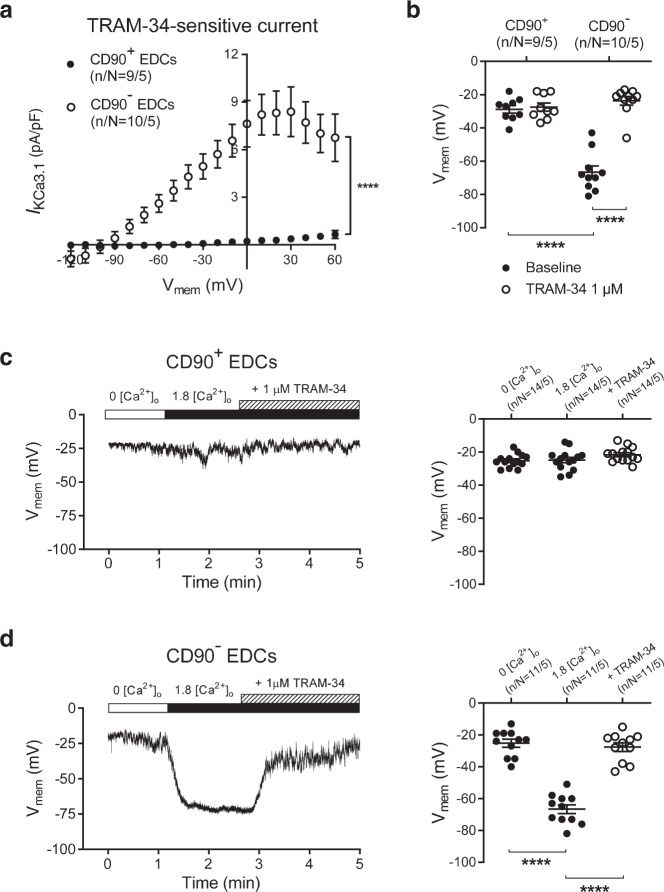
Fig. 2. Functional endogenous KCa3.1 current and membrane-potential changes during SOCE in EDCs.
a. I–V relationship of IKCa3.1 (TRAM-34–sensitive current) in CD90+ and CD90− EDCs. Data are mean ± SEM; n/N = cells/cell lines per group. b Resting potential of EDCs before and after exposure to 1 µmol/L TRAM-34. Two-way repeated-measures ANOVA with individual-mean comparisons by Bonferroni-corrected two-sided t-tests; n/N = cells/cell lines per group. Data are individual points along with mean and SEM. c Original current-clamp recording from one CD90+ cell (left panel) and mean ± SEM data for Vmem changes induced by SOCE (resulting from intracellular Ca2+-depletion by exposure to nominally Ca2+-free extracellular Ca2+ (0 [Ca2+]o) and then reintroduction of 1.8 mmol/L Ca2+ (1.8 [Ca2+]o)), with subsequent exposure to 1-µmol/L TRAM-34 (right panel). d Original current-clamp recording from one CD90− cell (left panel) and mean ± SEM data for Vmem changes induced by SOCE and subsequent exposure to 1 µmol/L TRAM-34 (right panel). One-way ANOVA with individual-mean comparisons by Bonferroni-corrected two-sided t-tests; numbers shown on bars are numbers of cells studied; n/N = cells/cell lines per group; Open circles = CD90−, closed circles = CD90+. EDC explant-derived cell, min minutes, Vme membrane potential. ****P < 0.0001. For precise P values, see Supplemental Source Data and Statistics file.

